
3. Finding "Gaps" in Tracked Campaigns
Find gaps in tracked campaigns aka campaigns with spend vs what is tracked in your creative / budget sheet.
This query will compare actively spending campaigns with campaign names in your budget/creative sheet, and show you which ones don’t have a corresponding match
These views build upon the views/SQL created to connect Creative / Budget Sheet information to Facebook spend. You can see instructions on how to create that base view here.
Instructions
Create your “gap” SQL
Login to Alli Data and select the client you want to create an action for
Navigate to Reports → Explorer and select New Data Report

Give your report a Name and update the Report Type to Custom Redshift

Copy and paste the SQL Example in from below and update anything within and including
{}to match your client settingsOnce your SQL is updated, click Publish to update the query
Click Preview to ensure the output is as expected
SQL (Alli Data)
Context
{clientname.facebook_datasource}references the Facebook data source you created in the Connecting Budget to Spend step{clientname.creative_budget_sheet}references the creative / budget sheet data source you created in the Connecting Budget to Spend stepcolumn names should match what is available in the above. So, for example, if the campaign name is called
creative_namein your creative / budget sheet, replace thecampaign_namein line 10 withcreative_name
Query
select campaign_name from {clientname.facebook_datasource}
    where date_start = current_date
    group by campaign_name
    having sum(spend) > 0
 except
    select campaign_name from {clientname.creative_budget_sheet}
Live Example Using Fake Datasources
select campaign_name from client_name.facebook
    where date_start = current_date
    group by campaign_name
    having sum(spend) > 0
 except
    select campaign_name from client_name.example_budget_sheet
Utilize SQL In DataStudio
Instructions
Brand New Blank DataStudio
Create a blank data studio report
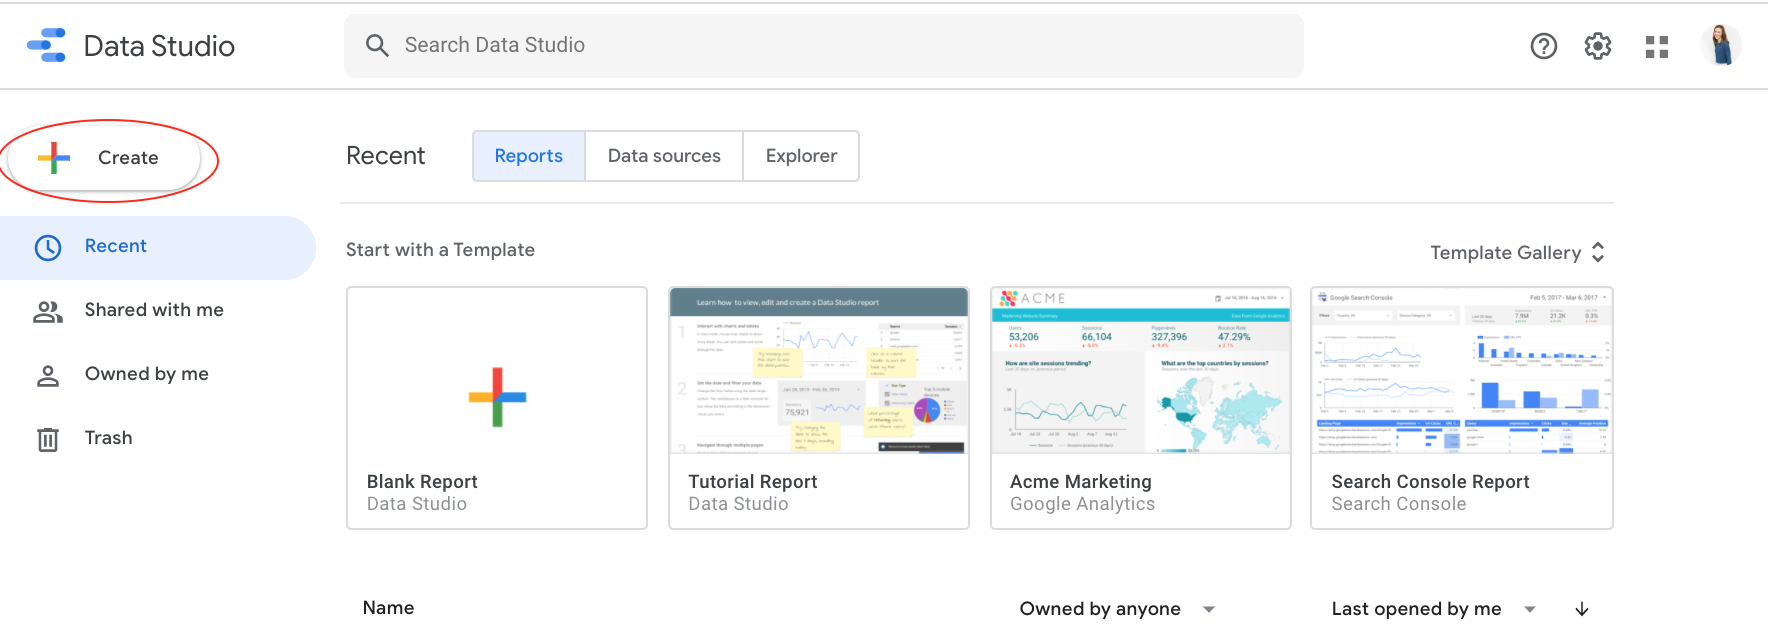
Navigate to Datastudio reporting and select Create → Report
Select Bigquery as your datasource type
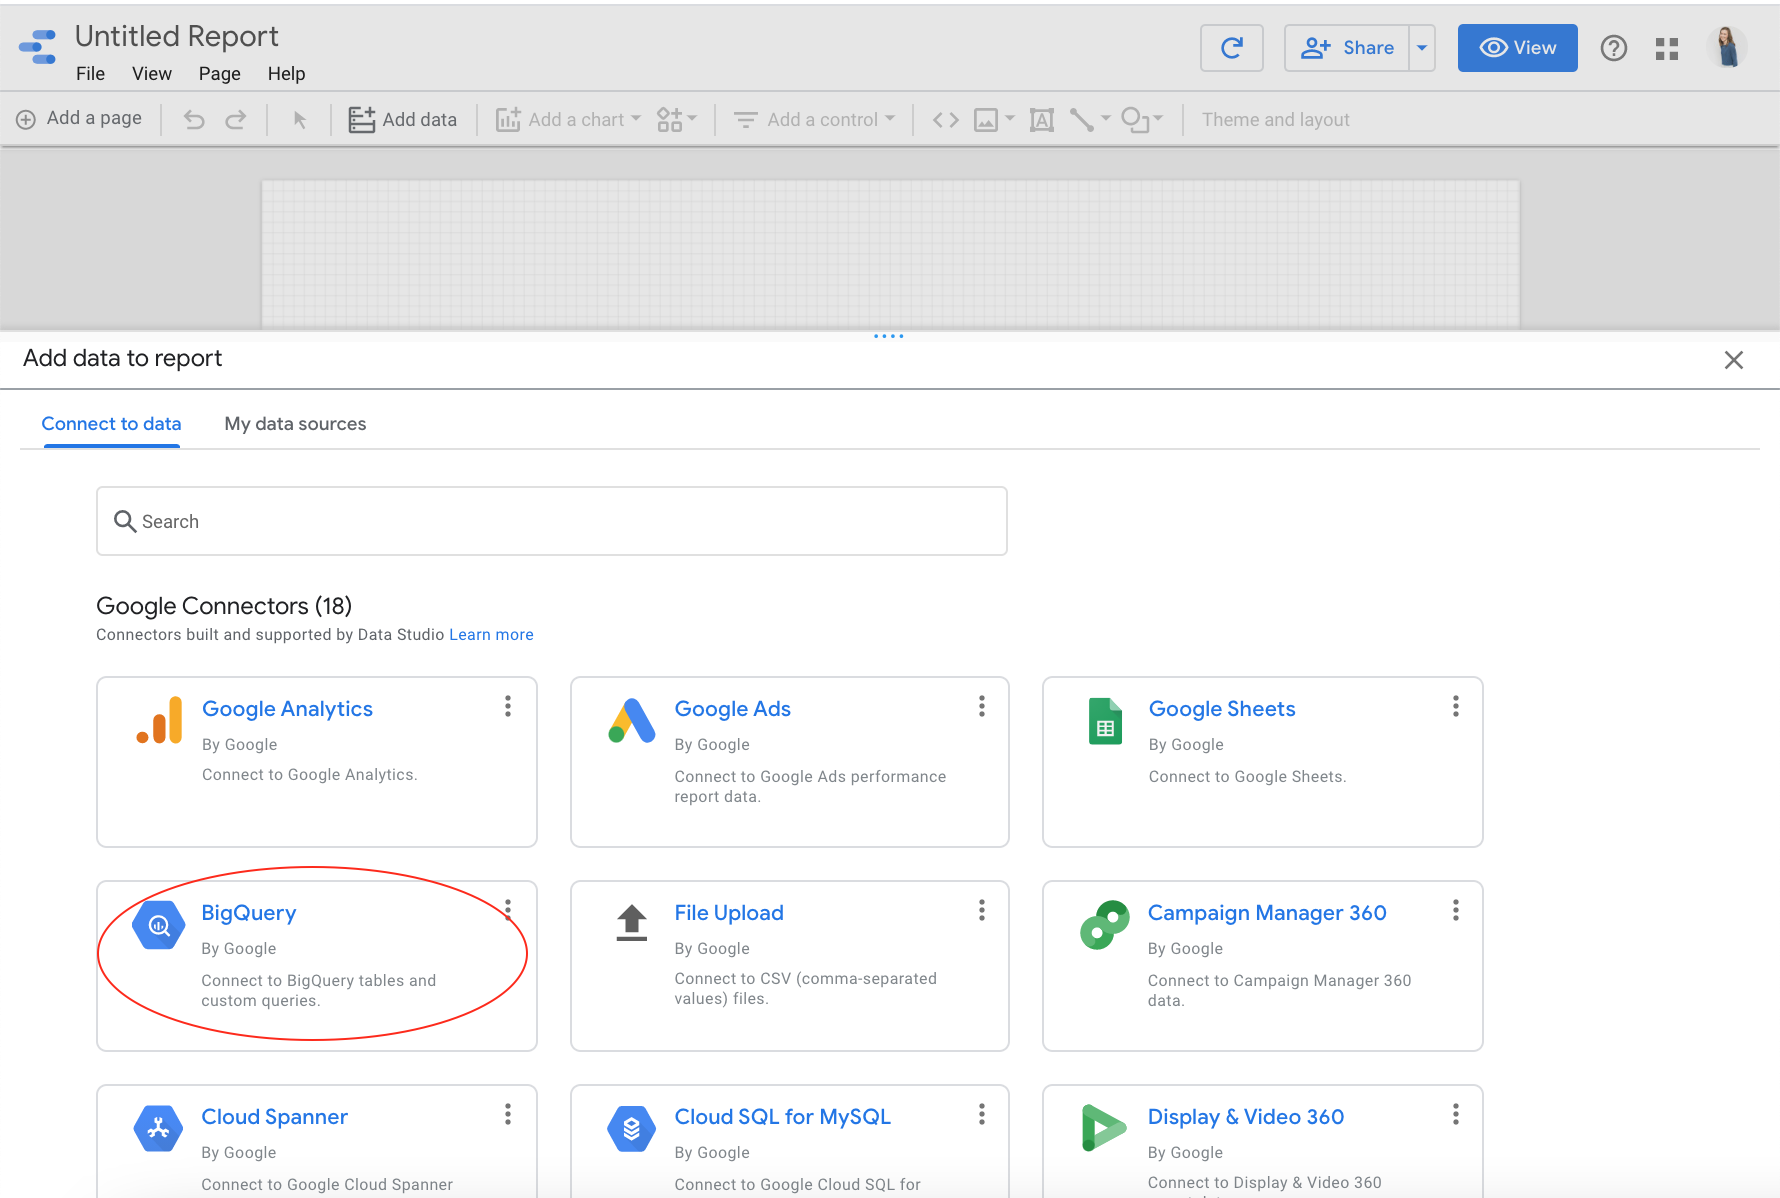
On the left, select Custom Query and choose your Bigquery project titled alli-{your bq name}.
In the
Edit Custom Querybox, copy & paste the exact SQL you created originally in the Connect Budget to Spend step earlier. We’ll be applying the filters and creating the new Percent Spend column in Datastudio using it’s native features; much easier!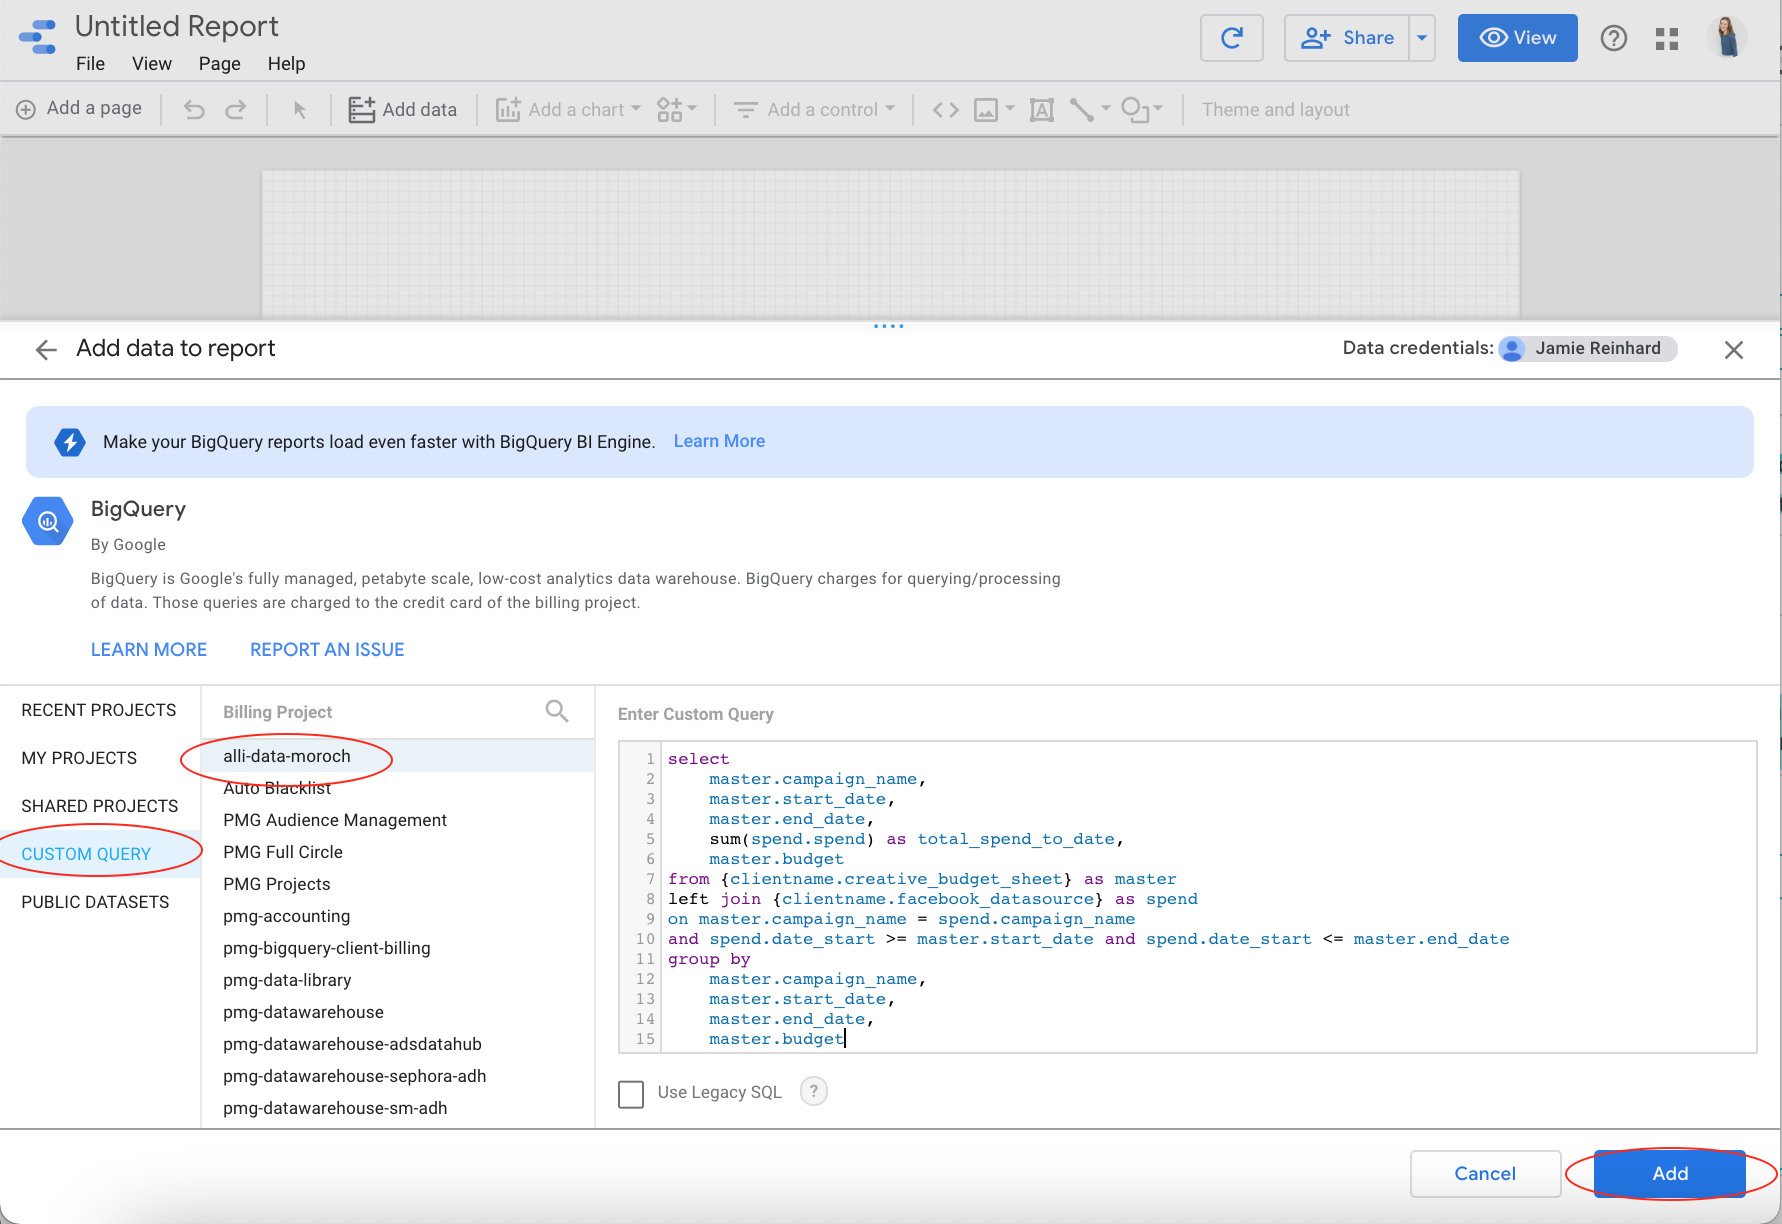
After pasting your SQL, click Add, and in the pop-up that follows select Add to Report

Now you can rename your report, and drag & drop columns according to what you’d like to view
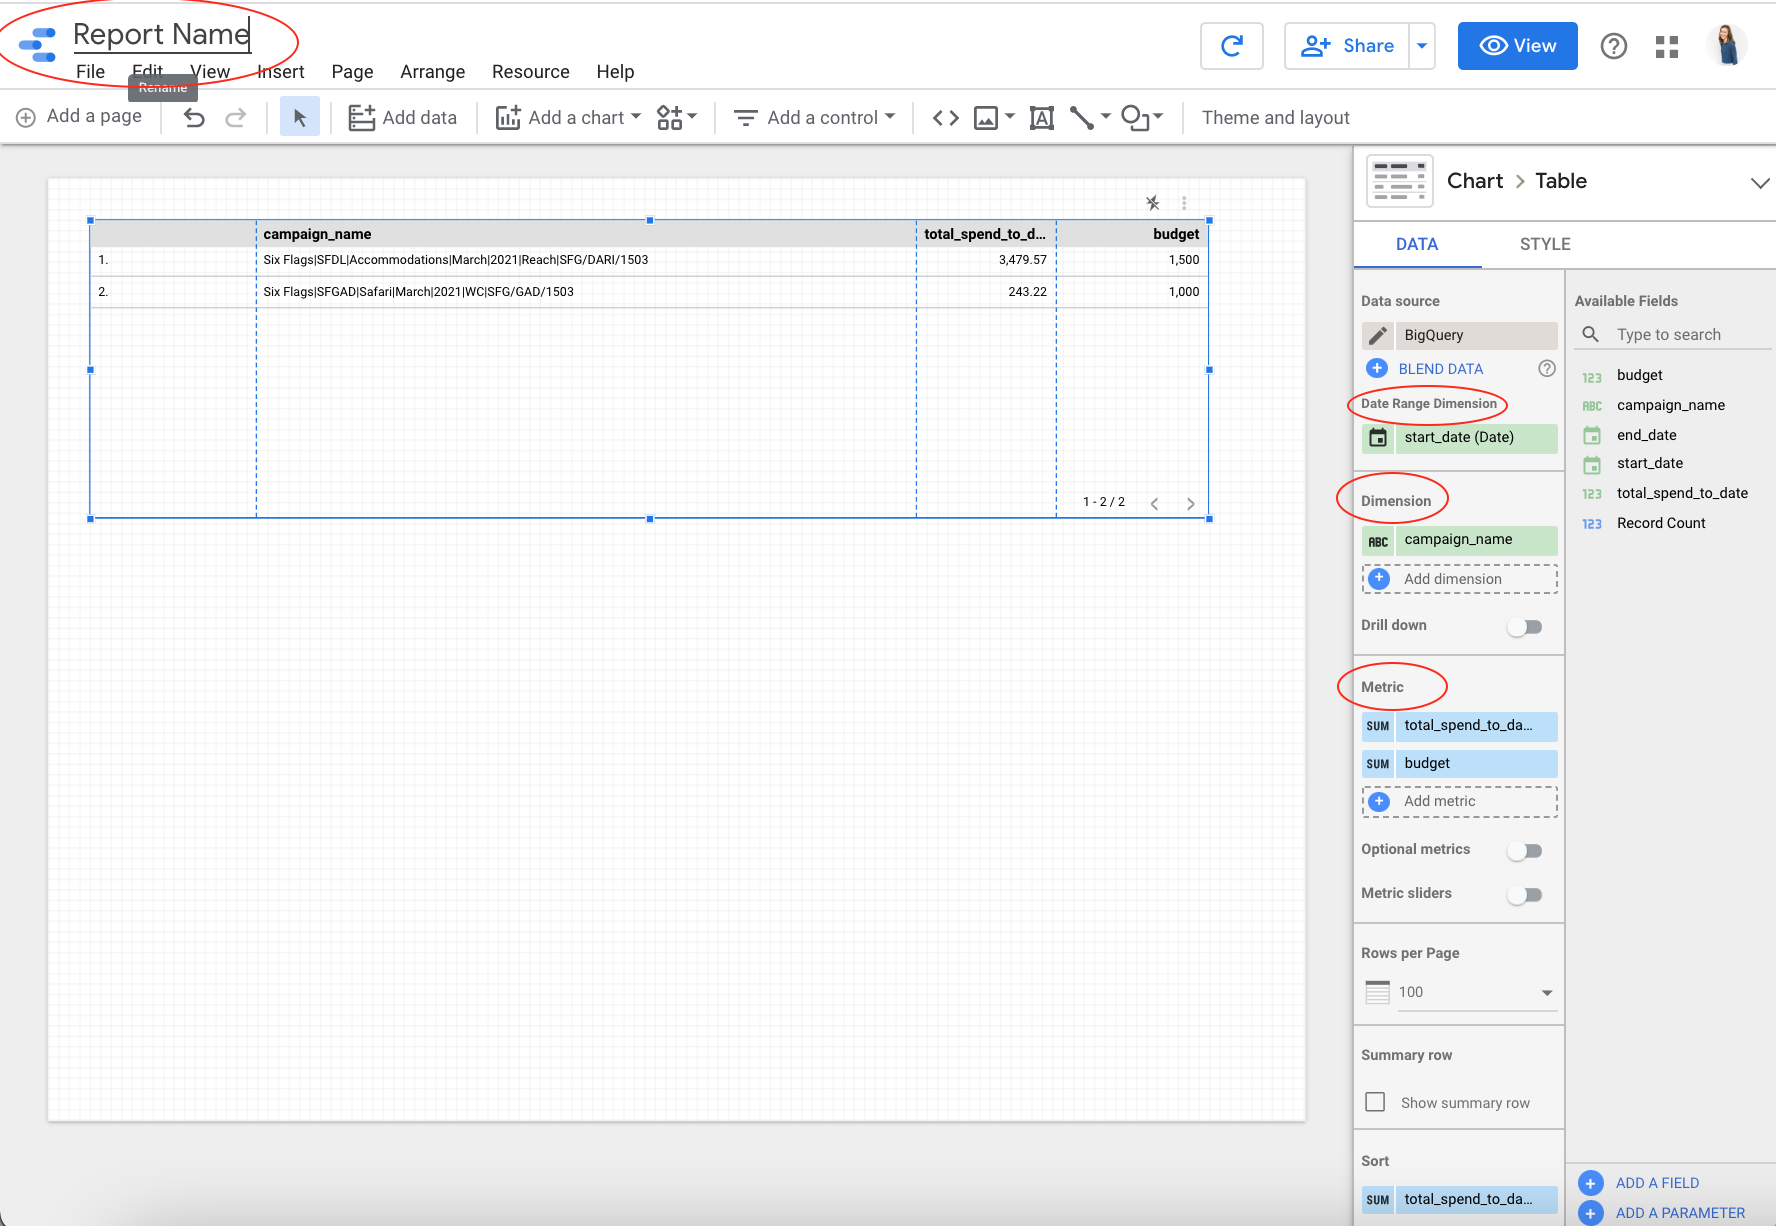
Drag & drop your date column into the
Date Range DimensionfieldDrag & drop your non-numerical columns (like campaign_name) into the
DimensionsectionDrag & drop your numerical columns (spend to date & budget) into the
Metricsection
Adding to Existing DataStudio Report
Add a new datasource
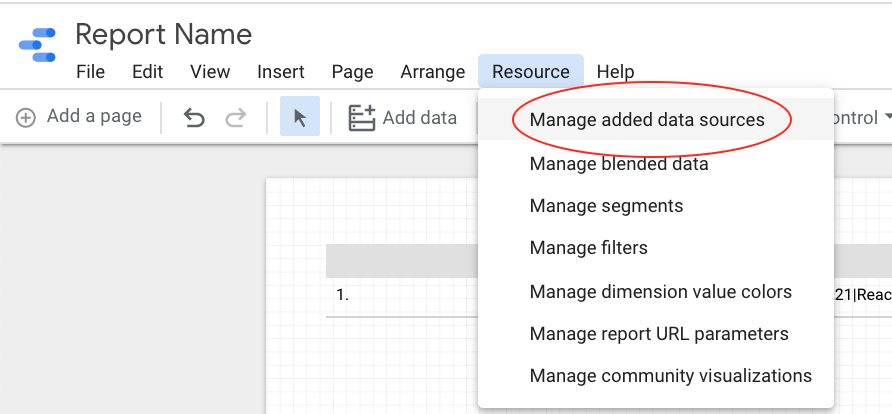
On the top navigation bar, select Manage Resources → Manage added data sources
Select Add A Data Source

Select Bigquery as your datasource type
On the left, select Custom Query and choose the Moroch Bigquery project titled alli-data-moroch.
In the
Edit Custom Querybox, copy & paste the Bigquery SQL belowAfter pasting your SQL, click Add, and in the pop-up that follows select Add to Report
(Optional) Your data source has been added and now you can rename your data sources to make it easier to differentiate (you’ll notice both data sources in this example are named Bigquery) by clicking the Edit button & renaming at the top left


After renaming, select Close and you can begin leveraging this new data source. You can copy existing charts and switch out the data source in the
Data sourcesection of any chart. Or you can select Add a Chart and create a brand new chart

SQL (Bigquery / Datastudio)
Context
{clientname.facebook_datasource}references the Facebook data source you created in the Connecting Budget to Spend step{clientname.creative_budget_sheet}references the creative / budget sheet data source you created in the Connecting Budget to Spend stepcolumn names should match what is available in the above. So, for example, if the campaign name is called
creative_namein your creative / budget sheet, replace thecampaign_namein line 10 withcreative_name
select distinct campaign_name
from {clientname.facebook_datasource}
where campaign_name in
(
select campaign_name from {clientname.facebook_datasource}
    where cast(date_start as date) = current_date
    group by campaign_name
    having sum(spend) > 0
 except distinct
    select campaign_name from {clientname.creative_budget_sheet}
)
Live Example with Fake Datasources
select distinct campaign_name
from client_name.facebook
where campaign_name in
(
select campaign_name from client_name.facebook
    where cast(date_start as date) = current_date
    group by campaign_name
    having sum(spend) > 0
 except distinct
    select campaign_name from client_name.example_budget_sheet
)