
2. Singling Out Over-Pacing Campaigns
Single out campaigns which are over-pacing using either Alli Data or Datastudio
These views build upon the views/SQL created to connect Creative / Budget Sheet information to Facebook spend. You can see instructions on how to create that base view here.
Instructions: Alli Data
Create your over-pacing SQL
Login to Alli Data and select the client you want to create an query for
Navigate to Reports → Explorer and select New Data Report
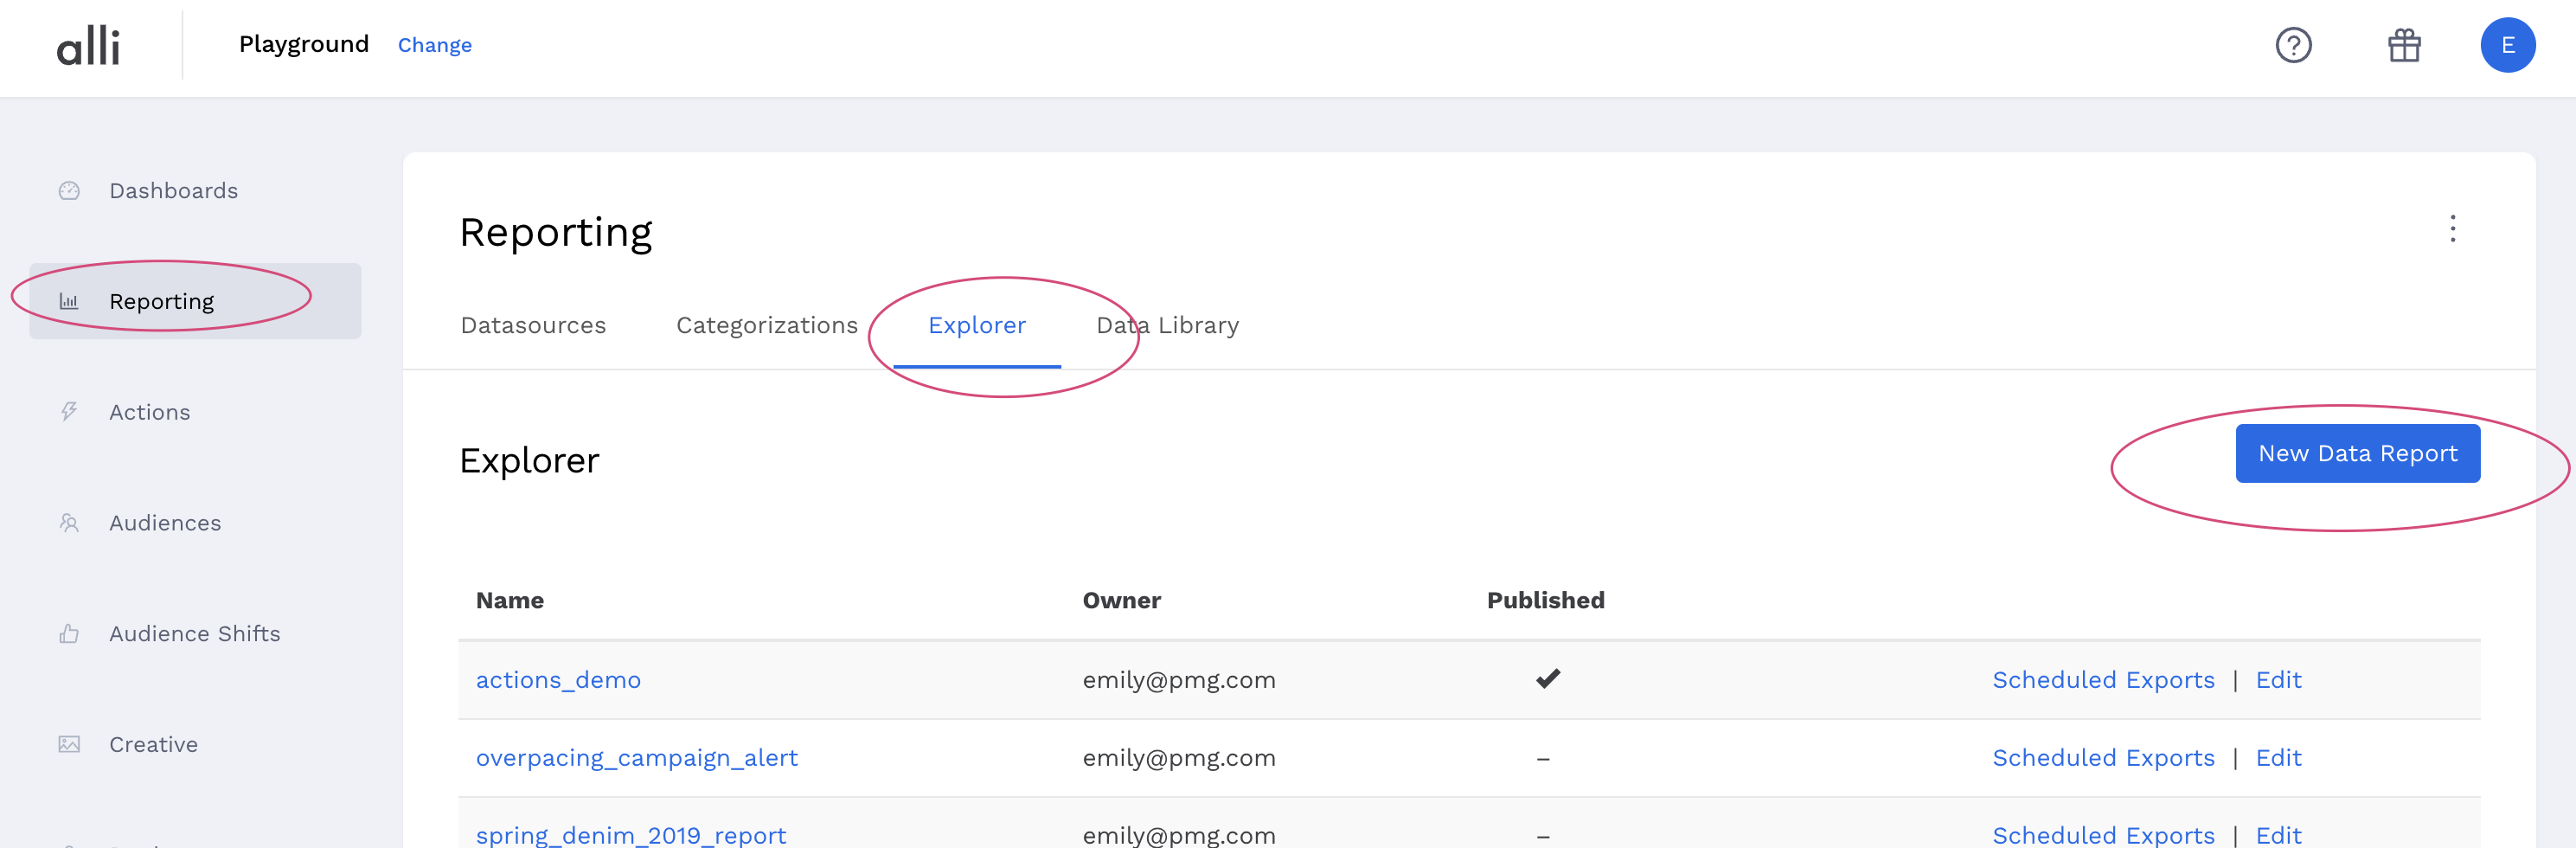
Give your report a Name and update the Report Type to Custom Redshift
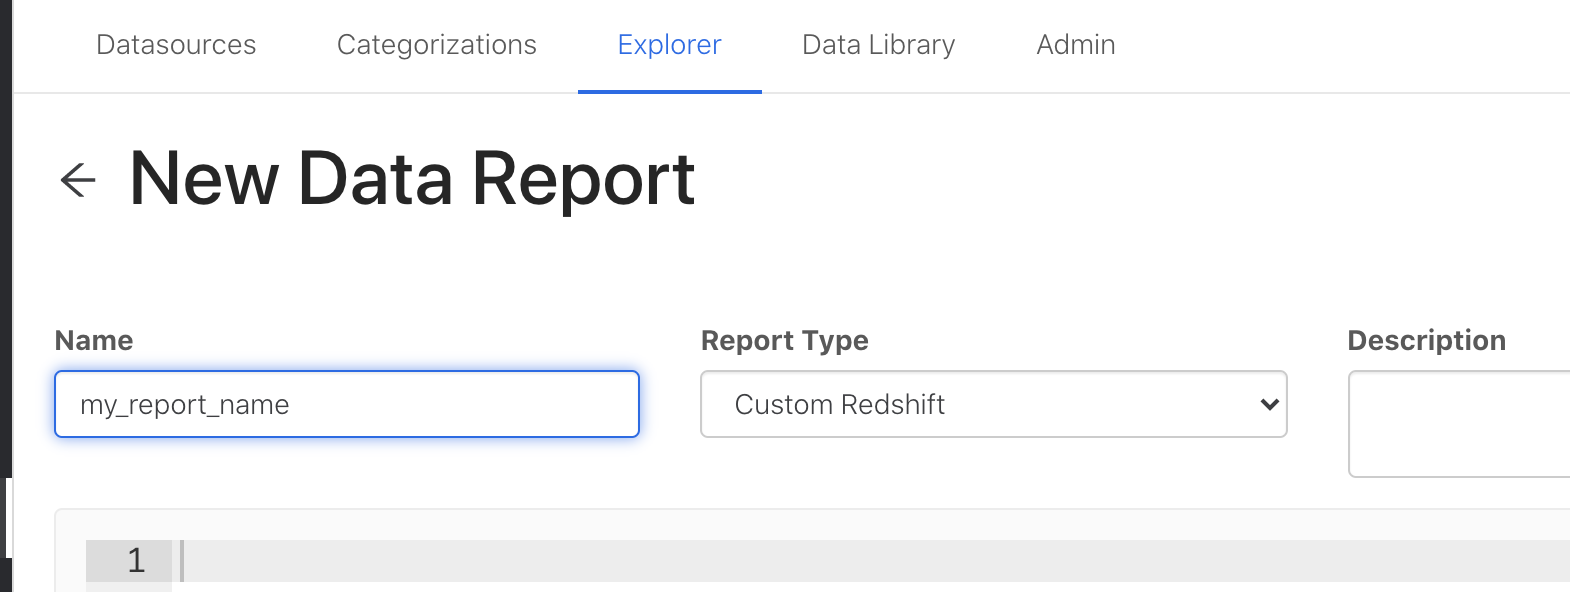
Copy and paste the SQL Example in from below and update anything within and including
{}to match your client settingsOnce your SQL is updated, click Publish to update the query
Click Preview to ensure the output is as expected
SQL Example
Context:
{client_name.example_connected_fb}should correspond to the name of the SQL View/Report you created earlier (in the Connecting Budget to Spend step). Replace this with your client name and the name you gave your reportselect *will pull in all the columns from the report you name in yourfromstatementWe add Percent Spent by dividing
total_spend_to_datebybudget. If either of these columns have different names in your view, switch out those namesReplace the
{#}with whatever threshold you are looking forwhere percent_spend >looks at our newly created columns, and only pulls out rows where the Percent Spend is greater than or equal to the number we pass.To adjust that, for example to see campaigns that are overpaced: utilize
where percent_spend >= 100. Or to filter to campaigns with greater than or equal to 80%, utilizewhere percent_spend >= 80>=is inclusive, so greater than or equal to our threshold. You can also utilize>to only select campaigns with greater than the threshold you set
select *,
        (total_spend_to_date / budget) * 100 as percent_spend
from {client_name.example_connected_fb}
where percent_spend >= {#}
Live Example with real datasources
select *,
        (total_spend_to_date / budget) * 100 as percent_spend
from client_name.example_connected_fb
where percent_spend > 100
Instructions: Data Studio
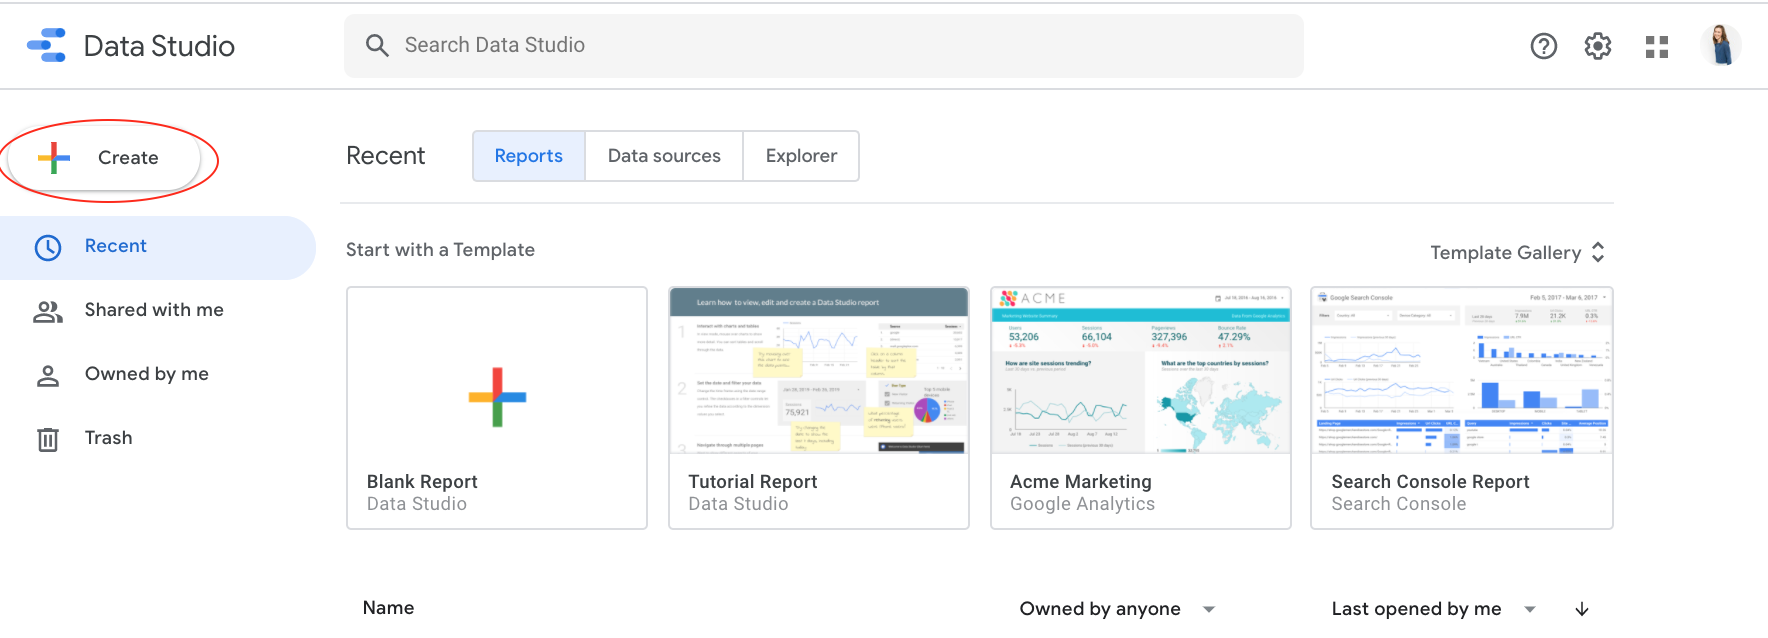
Create a blank data studio report
Navigate to Datastudio reporting and select Create → Report
Select Bigquery as your data source type
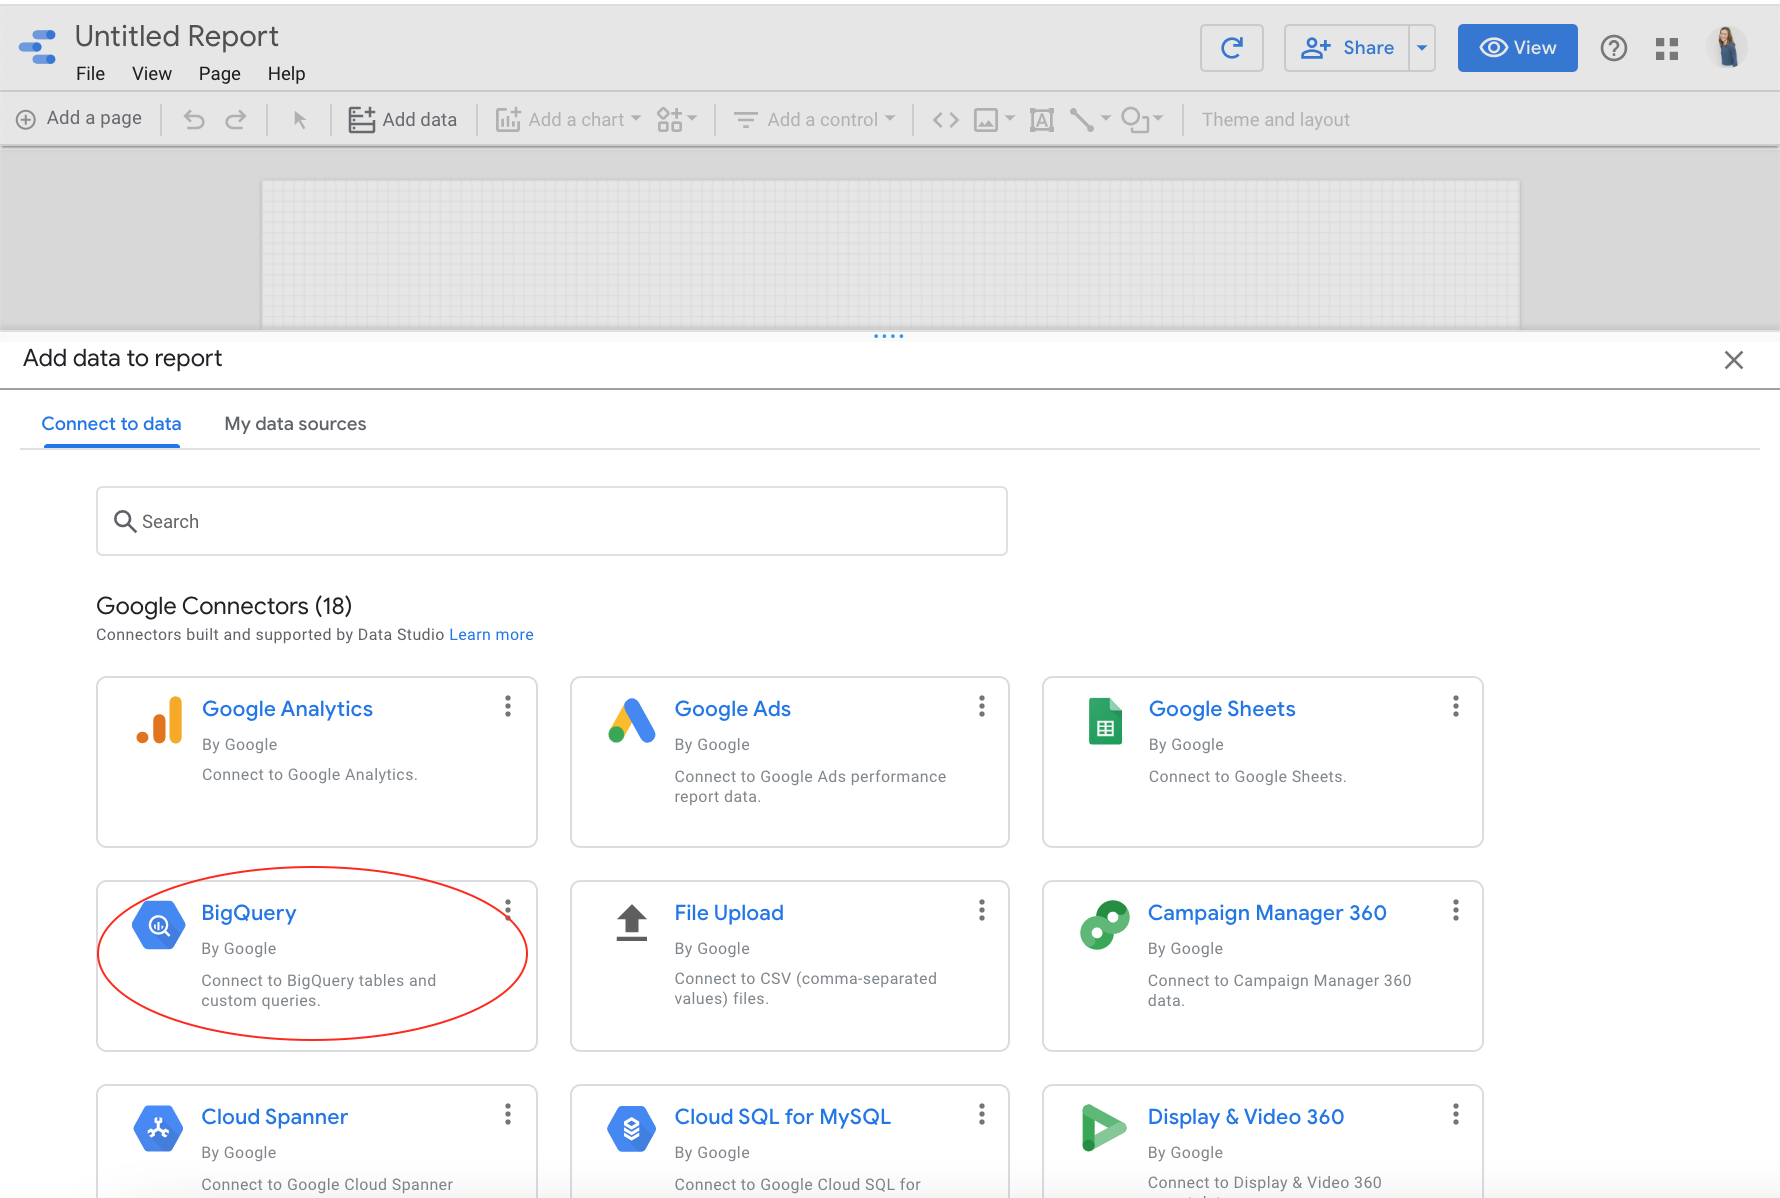
On the left, select Custom Query and choose your Bigquery project titled alli-name.
In the
Edit Custom Querybox, copy & paste the exact SQL you created originally in the Connect Budget to Spend step earlier. We’ll be applying the filters and creating the new Percent Spend column in Datastudio using it’s native features; much easier!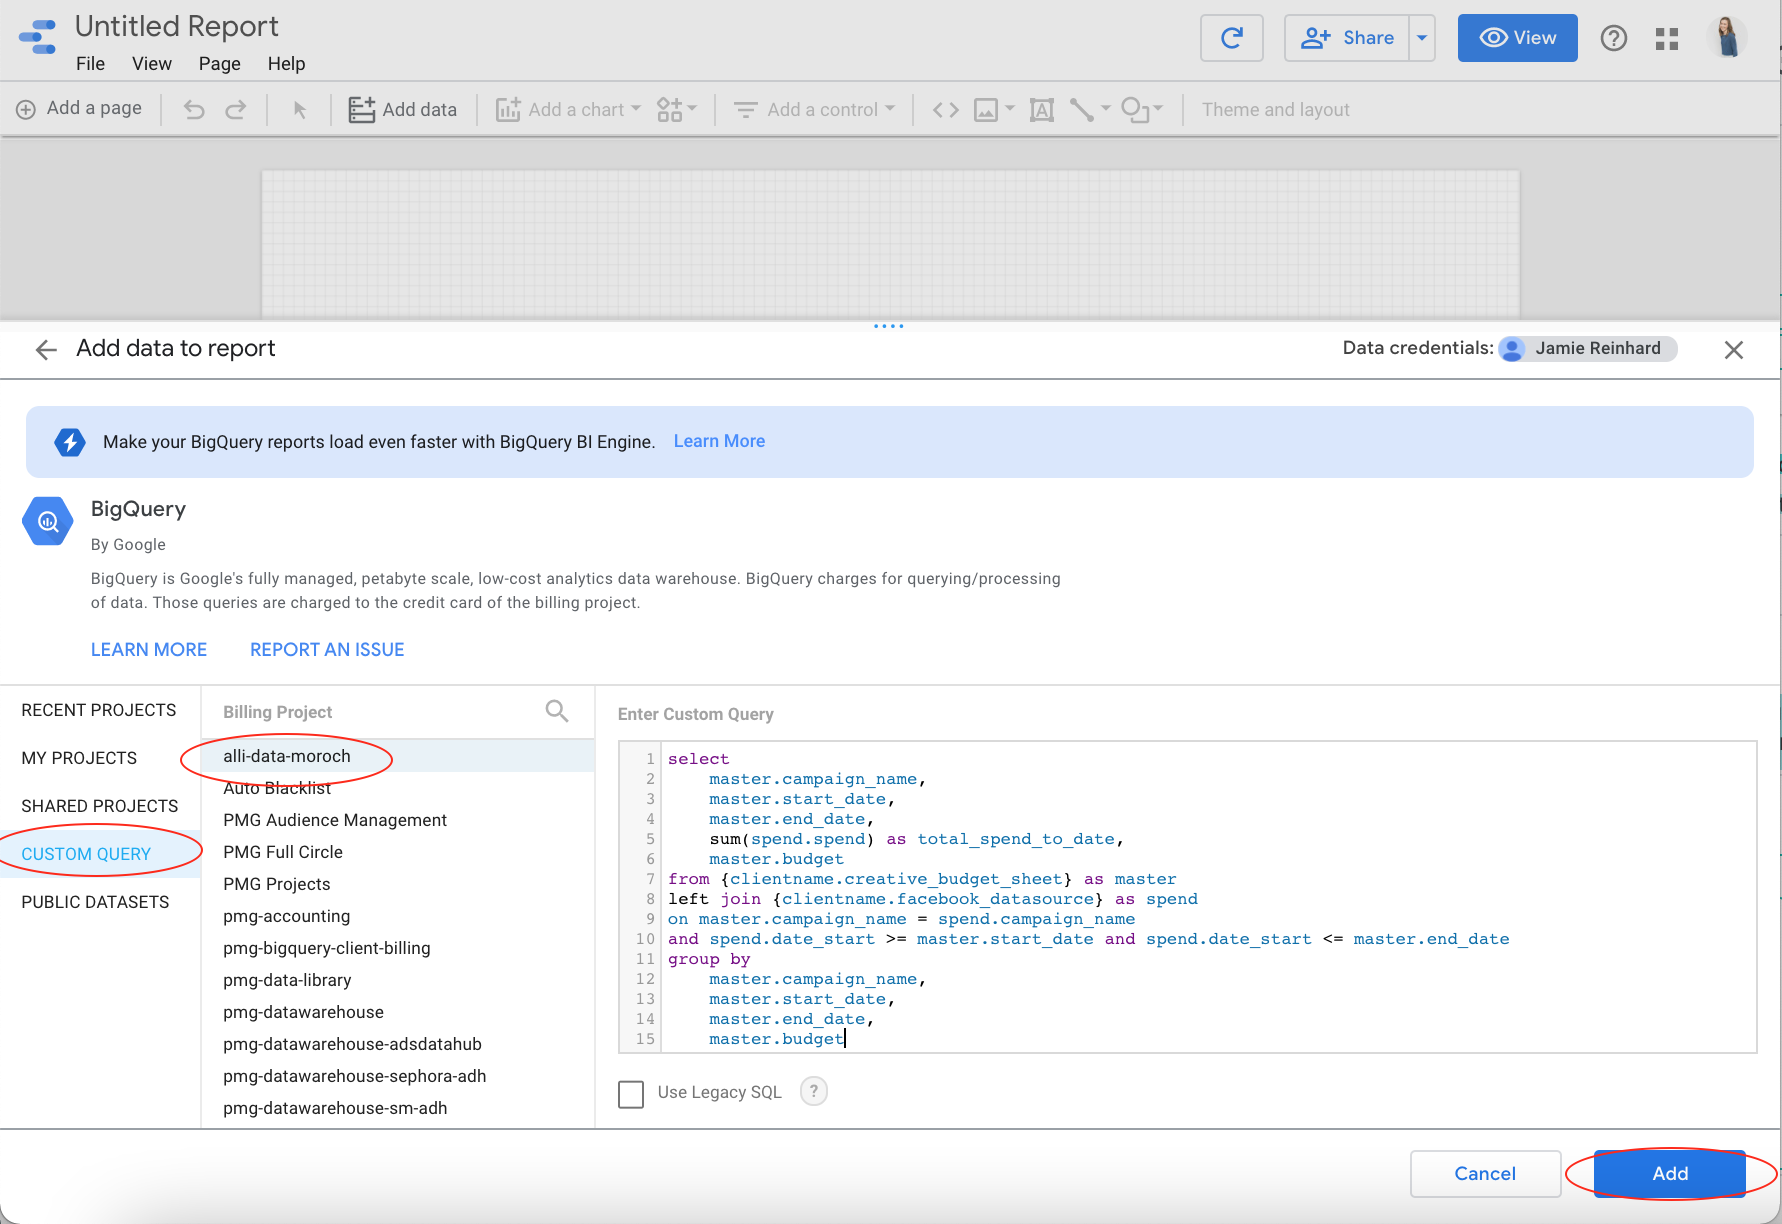
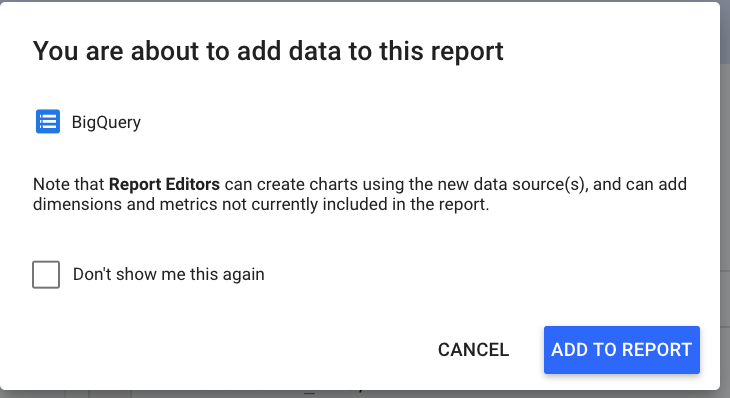
After pasting your SQL, click Add, and in the pop-up that follows select Add to Report
Now you can rename your report, and drag & drop columns according to what you’d like to view
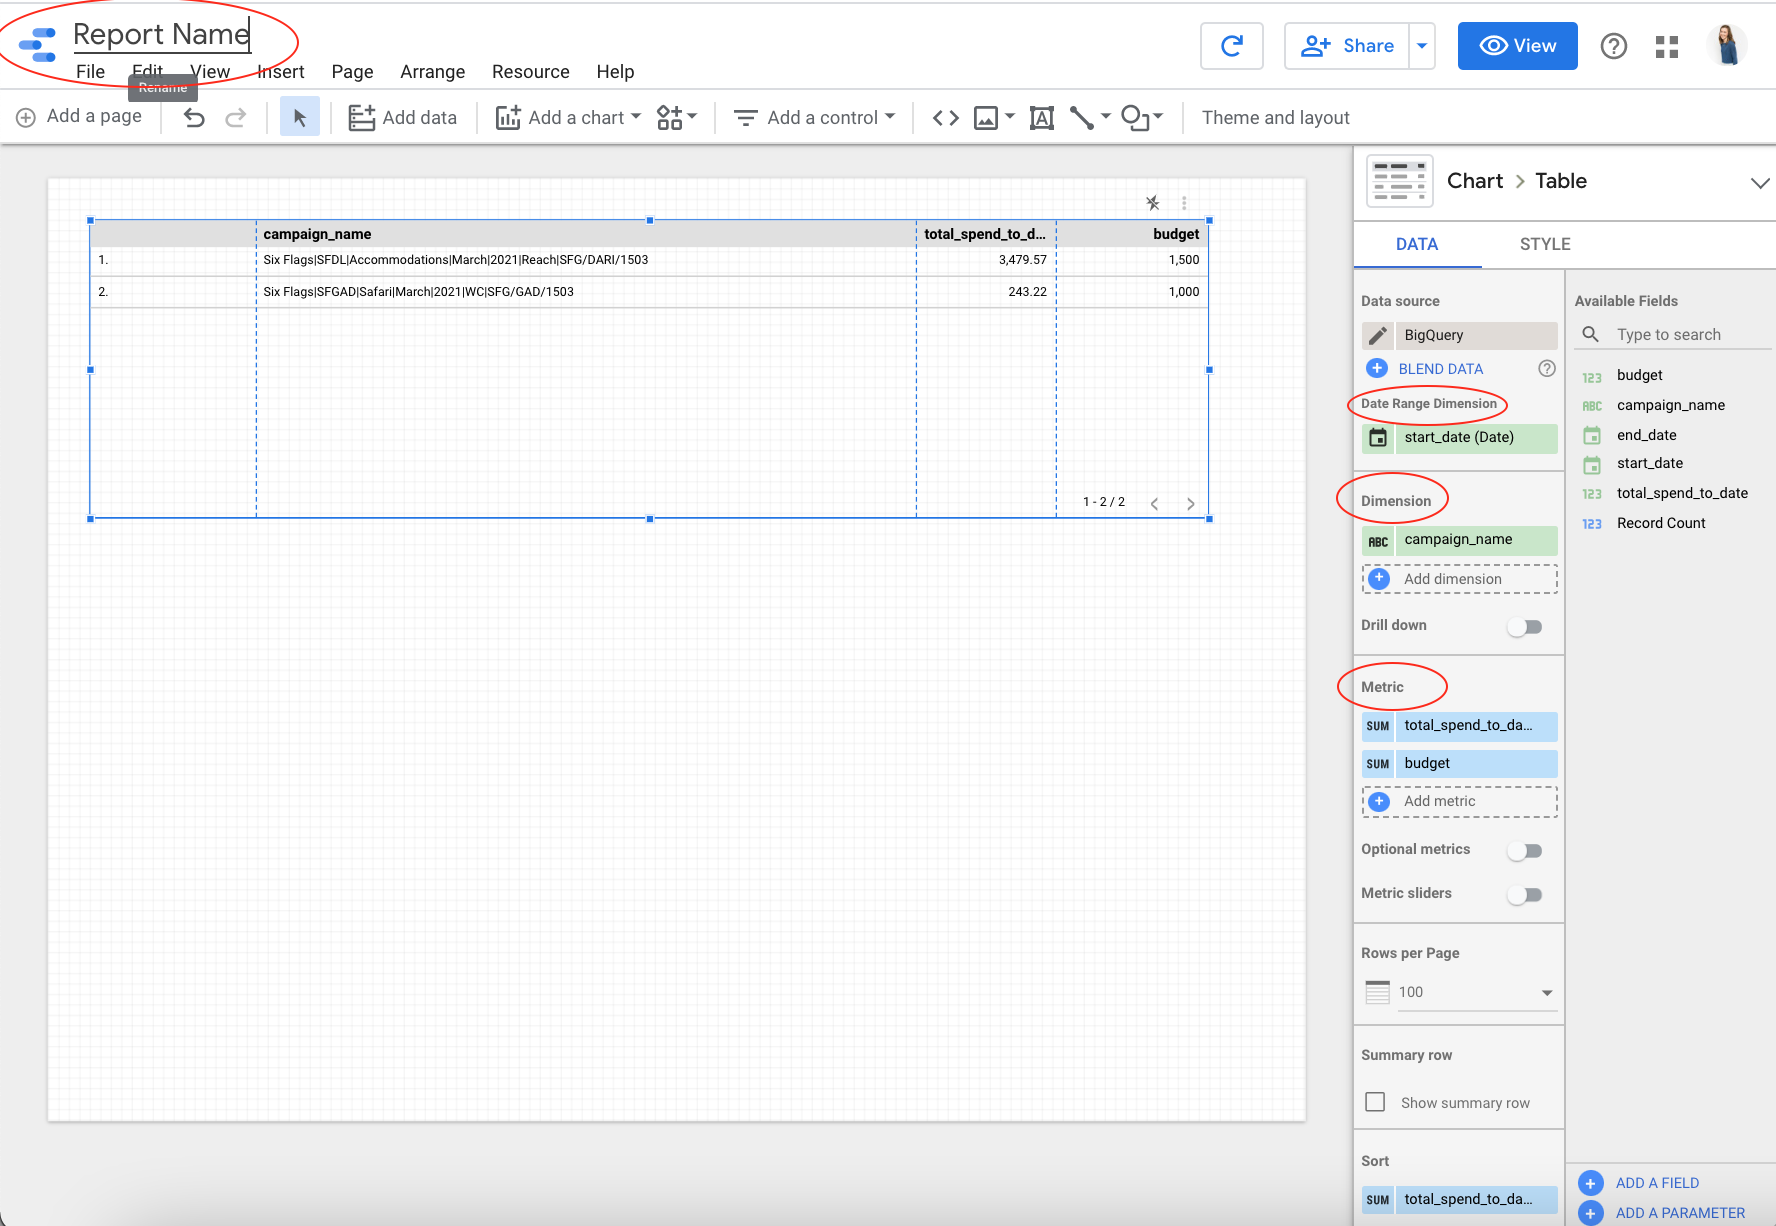
Drag & drop your date column into the
Date Range DimensionfieldDrag & drop your non-numerical columns (like campaign_name) into the
DimensionsectionDrag & drop your numerical columns (spend to date & budget) into the
Metricsection
Calculate Percent Spend
Click on your chart, and on the bottom far right, select Add Field
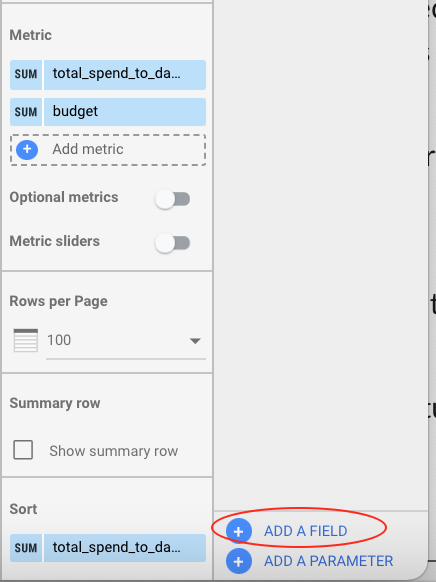
In the pop-up, rename your new value, and place the formula to calculate Percent Spend in the open box (
total_spend_to_date/budget) using the column names you can see on the left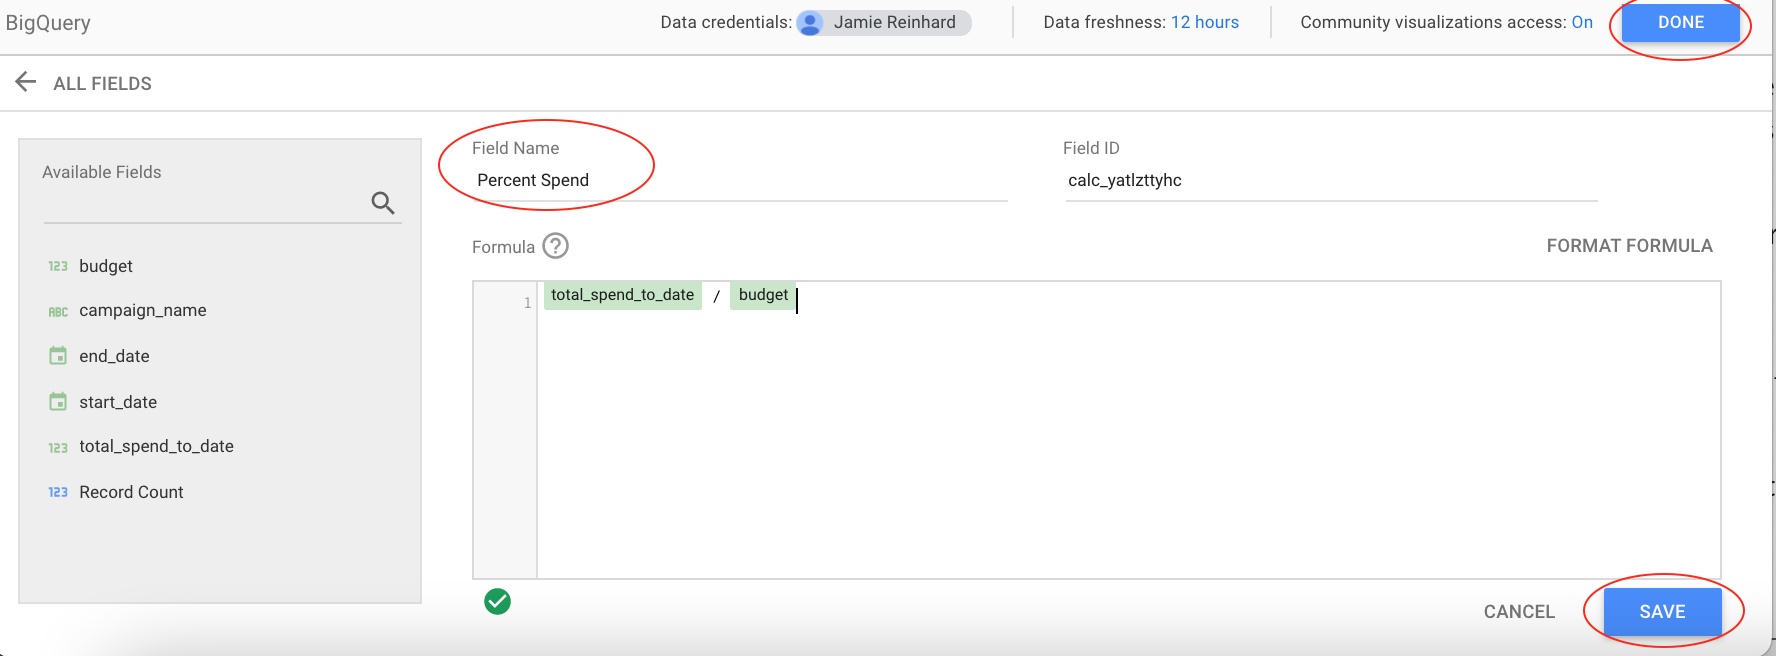
Click Save and then Done to finalize adding the new column
Now pull that new column into the
Dimensionsection & click on the edit button to the left of the new column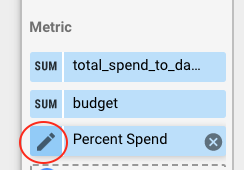
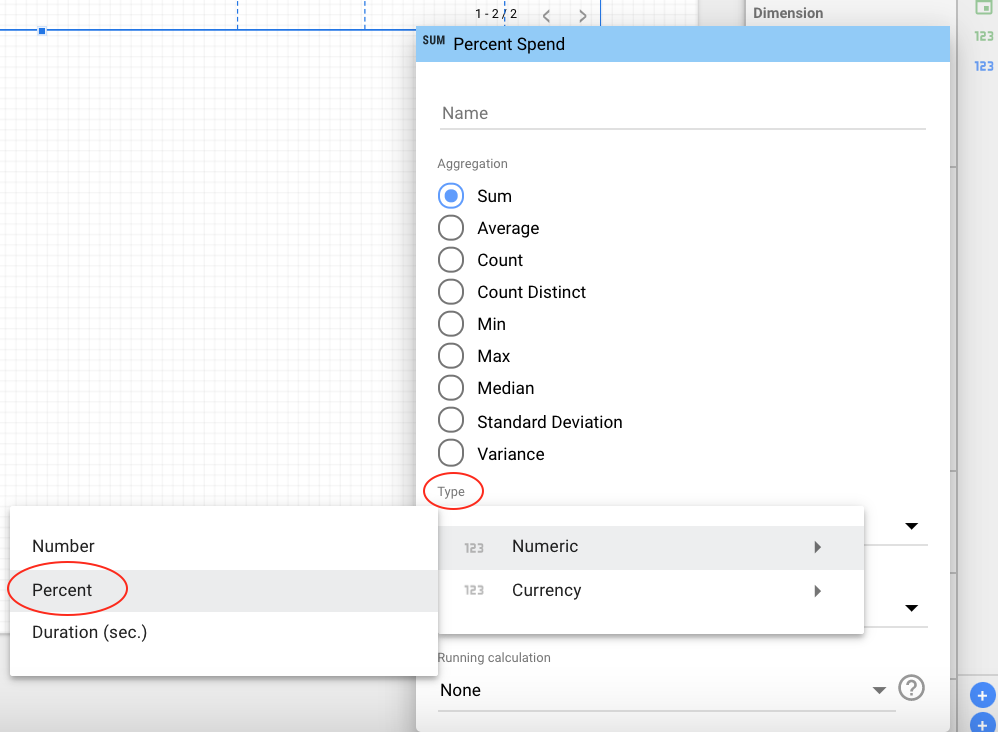
Select Type → Number → Percent to change the Percent Spend column from being displayed as a number to a percent (You can do this for any metric column, as well as change it’s visual name in the chart, or even how it is aggregated)
To filter to only over-pacing campaigns, with the chart selected, scroll to the bottom of the right side bar and select Add A Filter
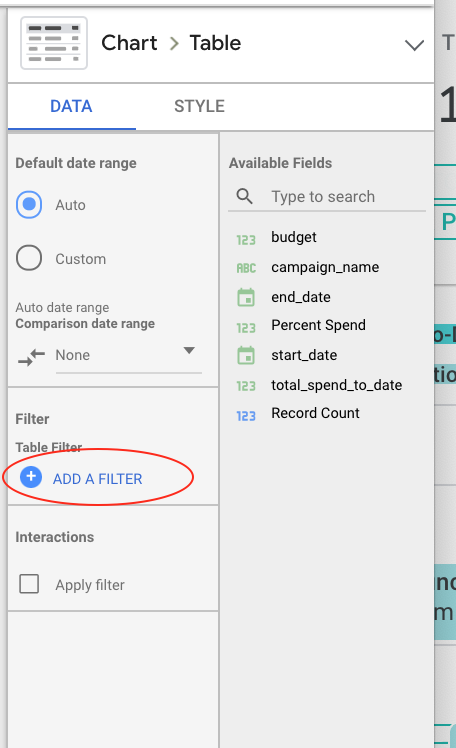
Select
includeand then choose your newly created Percent Spend column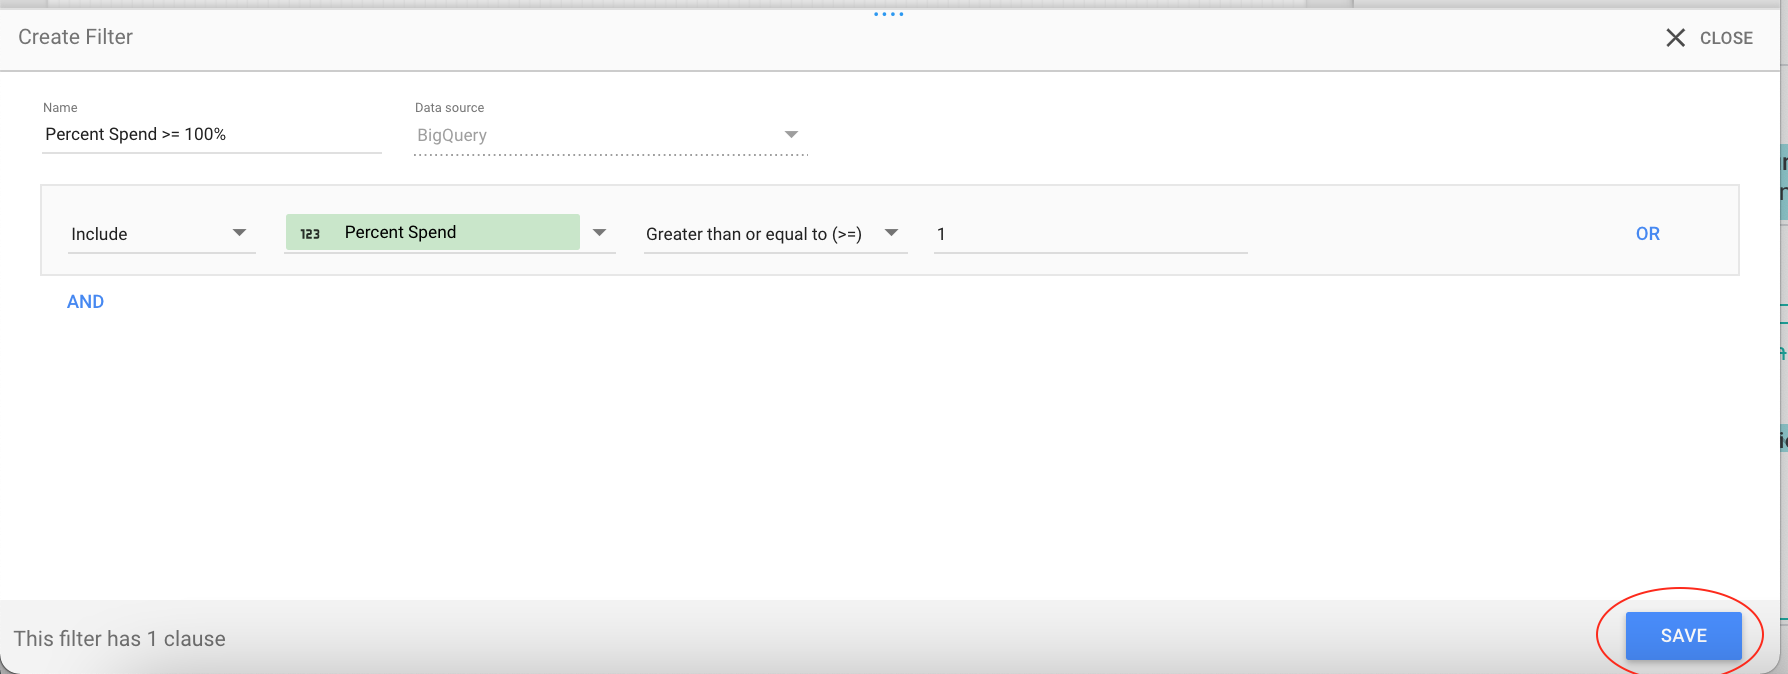
In the operator options, select either
Greater than or equal to (>=)orGreater than (>)according to your preferenceFinally, select the threshold you would like to set. Remember we are filtering the original value of Percent Spend, not the visual %, so to filter greater than 100%, we use > 1. Select Save when you are complete
And you’re done! You can use that filter on any chart in the DataStudio report, or create new ones for different charts (ie creating a chart of >= 80%, a chart of >= 100%, and a chart of <= 10% spent)