Learn how to create or edit an embedded dashboard for your client within Alli.
Creating or Editing your Client’s Dashboard
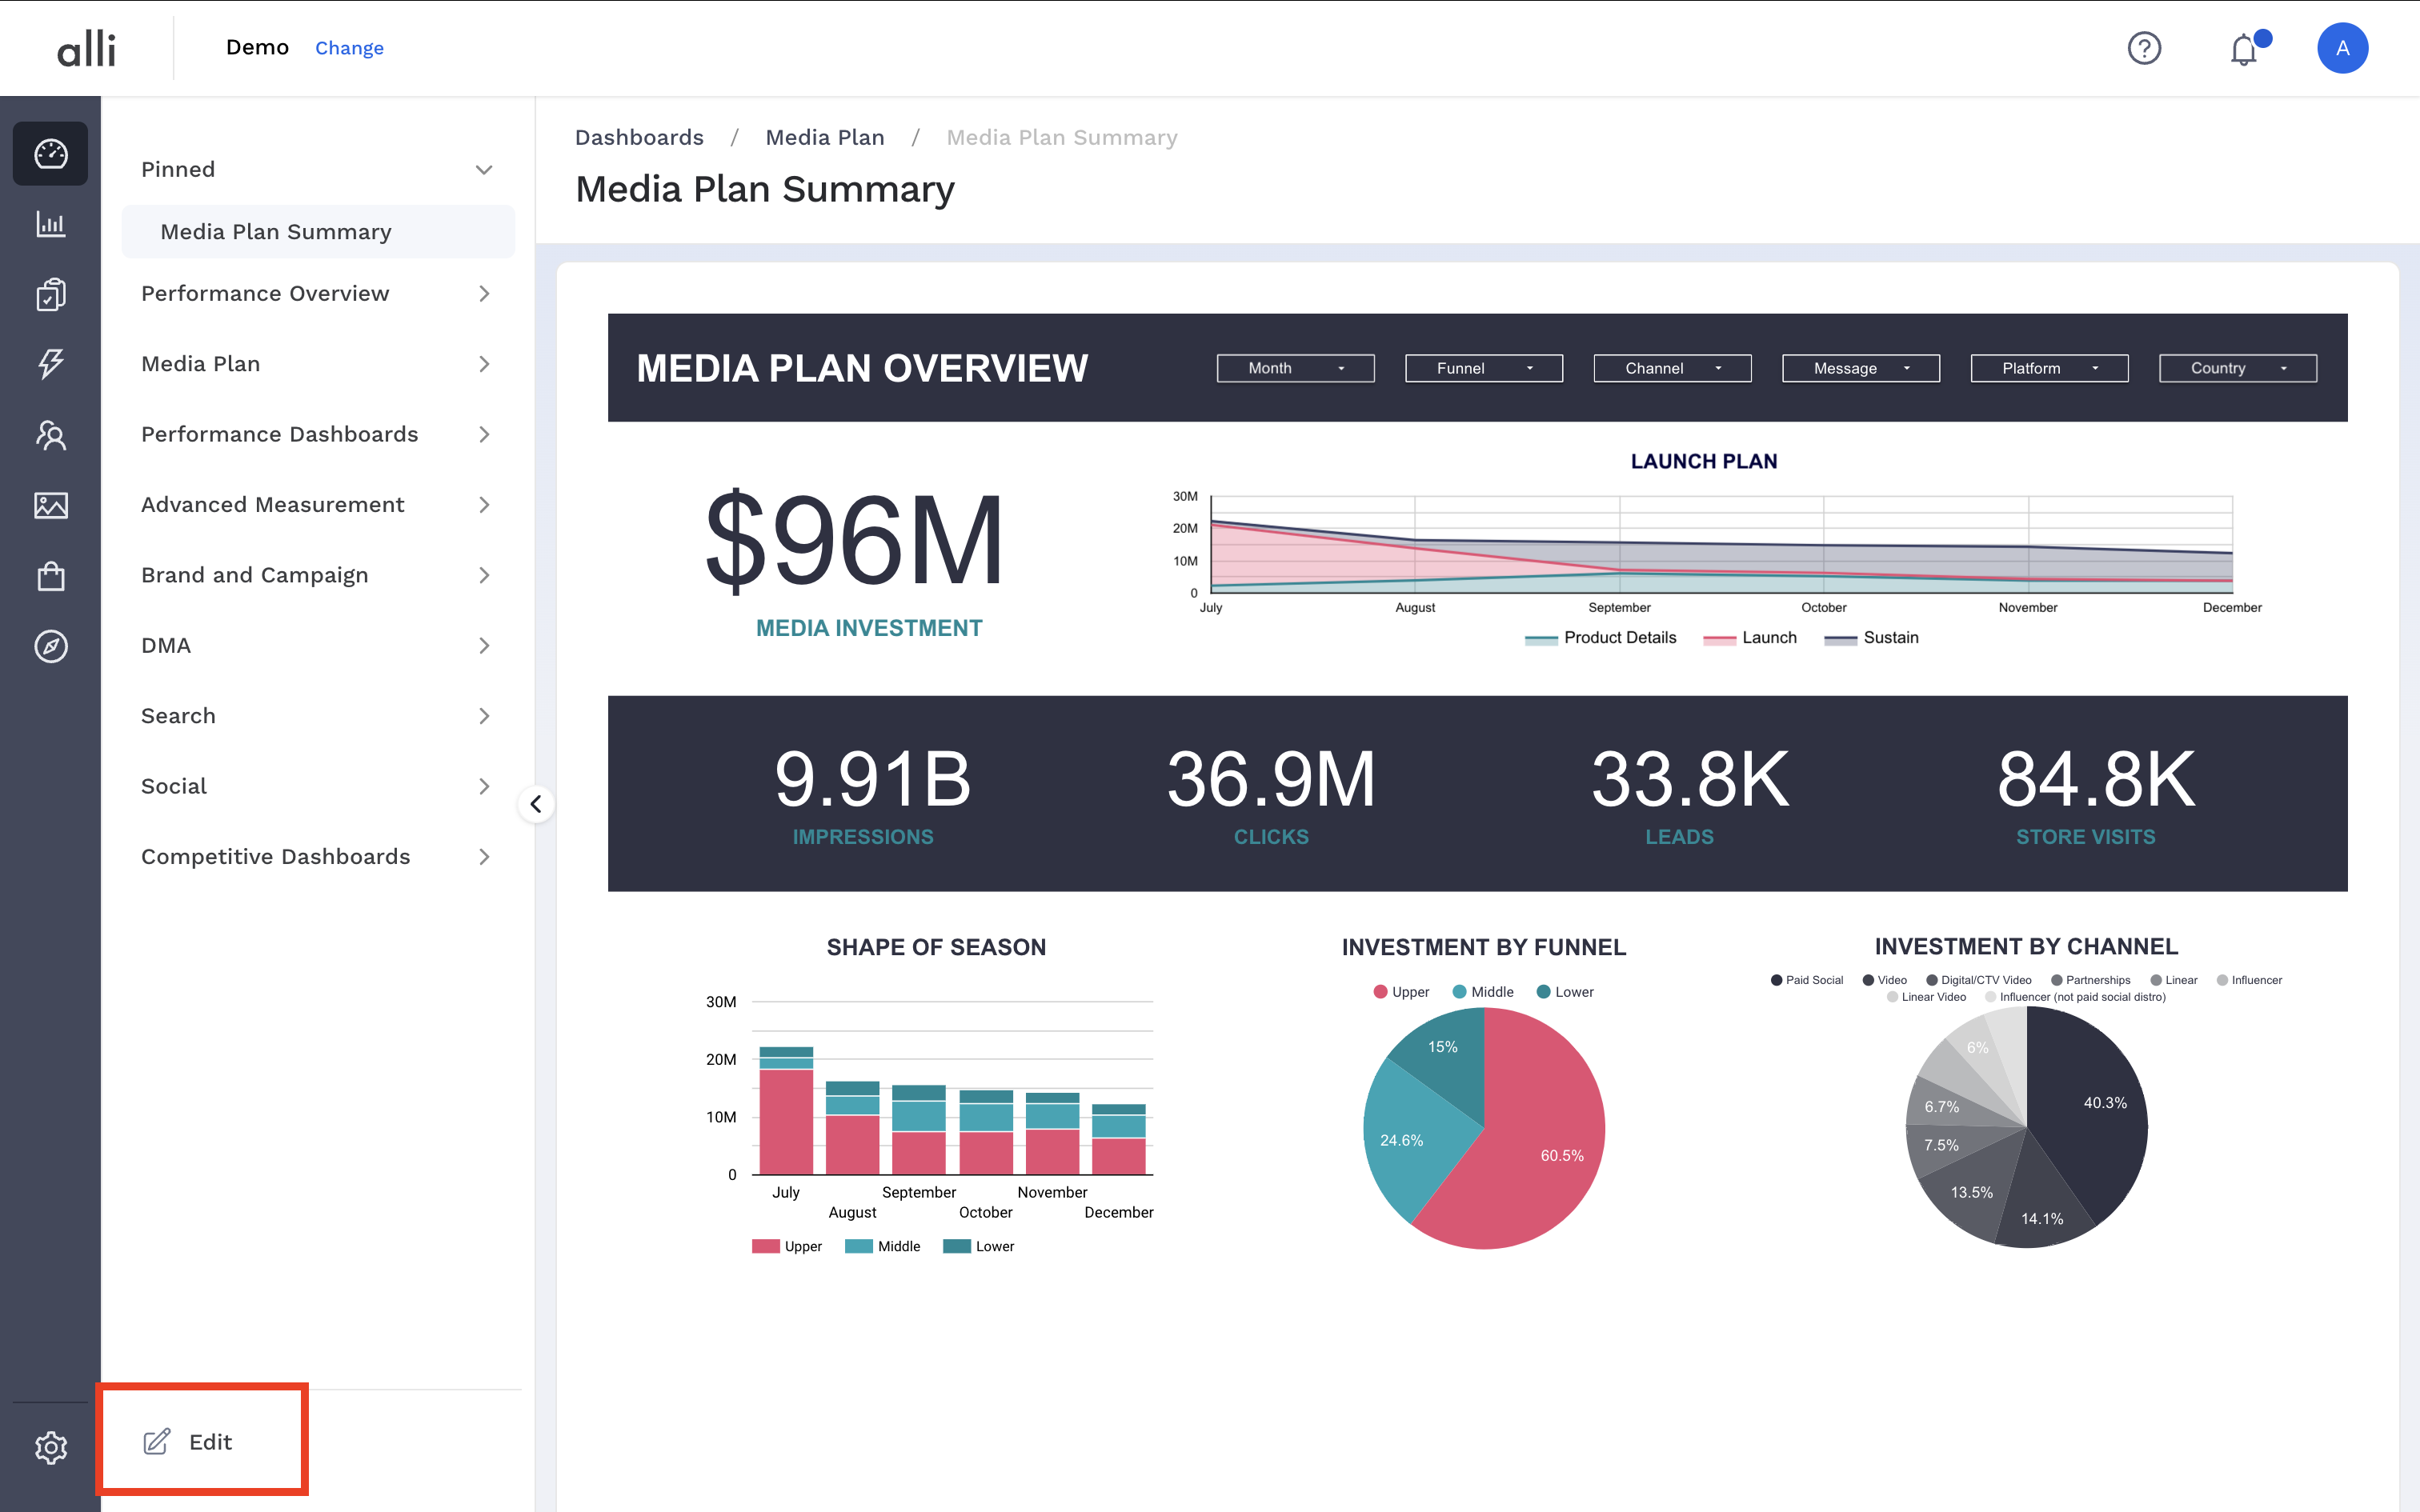
In order to make any changes to the client’s dashboard, you should first click on the Edit button in the bottom left, as shown in the image below. This will take you to the Dashboard Edit page.
The Dashboard Edit Page
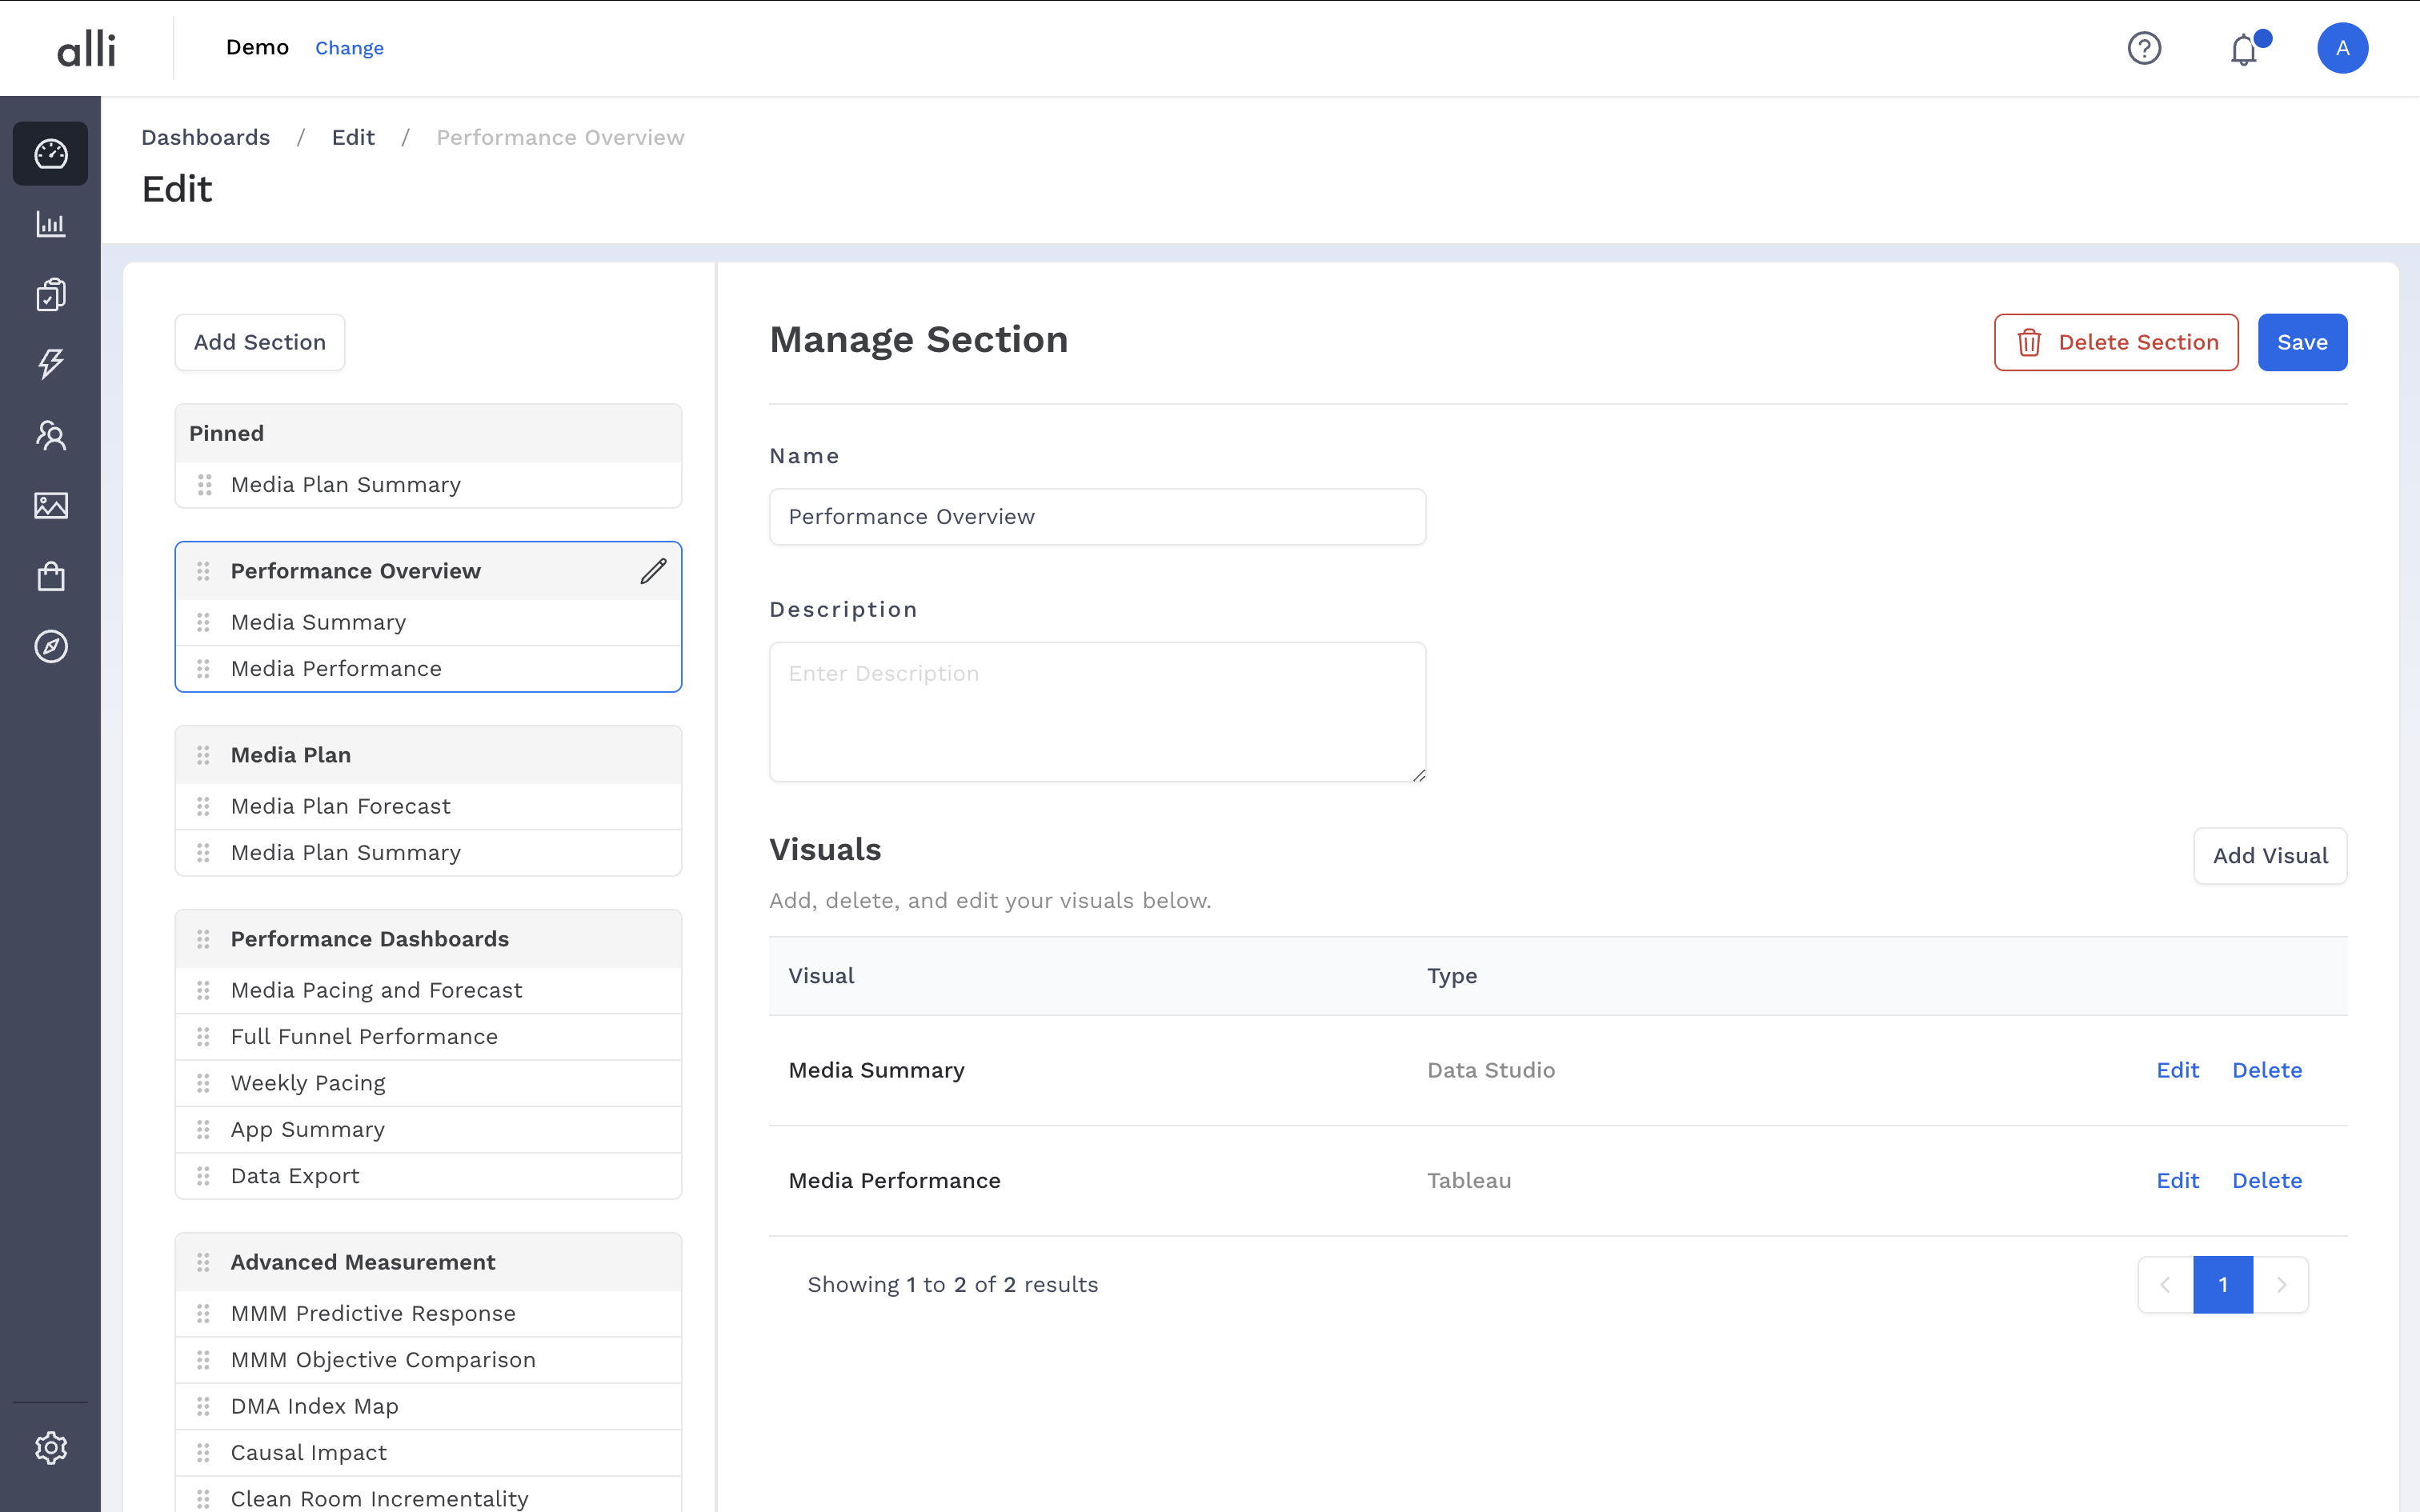
The dashboard edit page is where you can add new sections for your dashboards, reorder those sections, and add visualizations to them as well.
Creating a new Section
Sections are used to organize your dashboard visualizations. You can group all the reports that are used by the same client contact into one section, or group all weekly reports in one section, or use the sections in any way you find best for your client.
The pinned section that appears in the page is used to highlight dashboard visualizations that already appear in other sections, but need additional visibility. The pinned section will always appear at the top of your Dashboard.
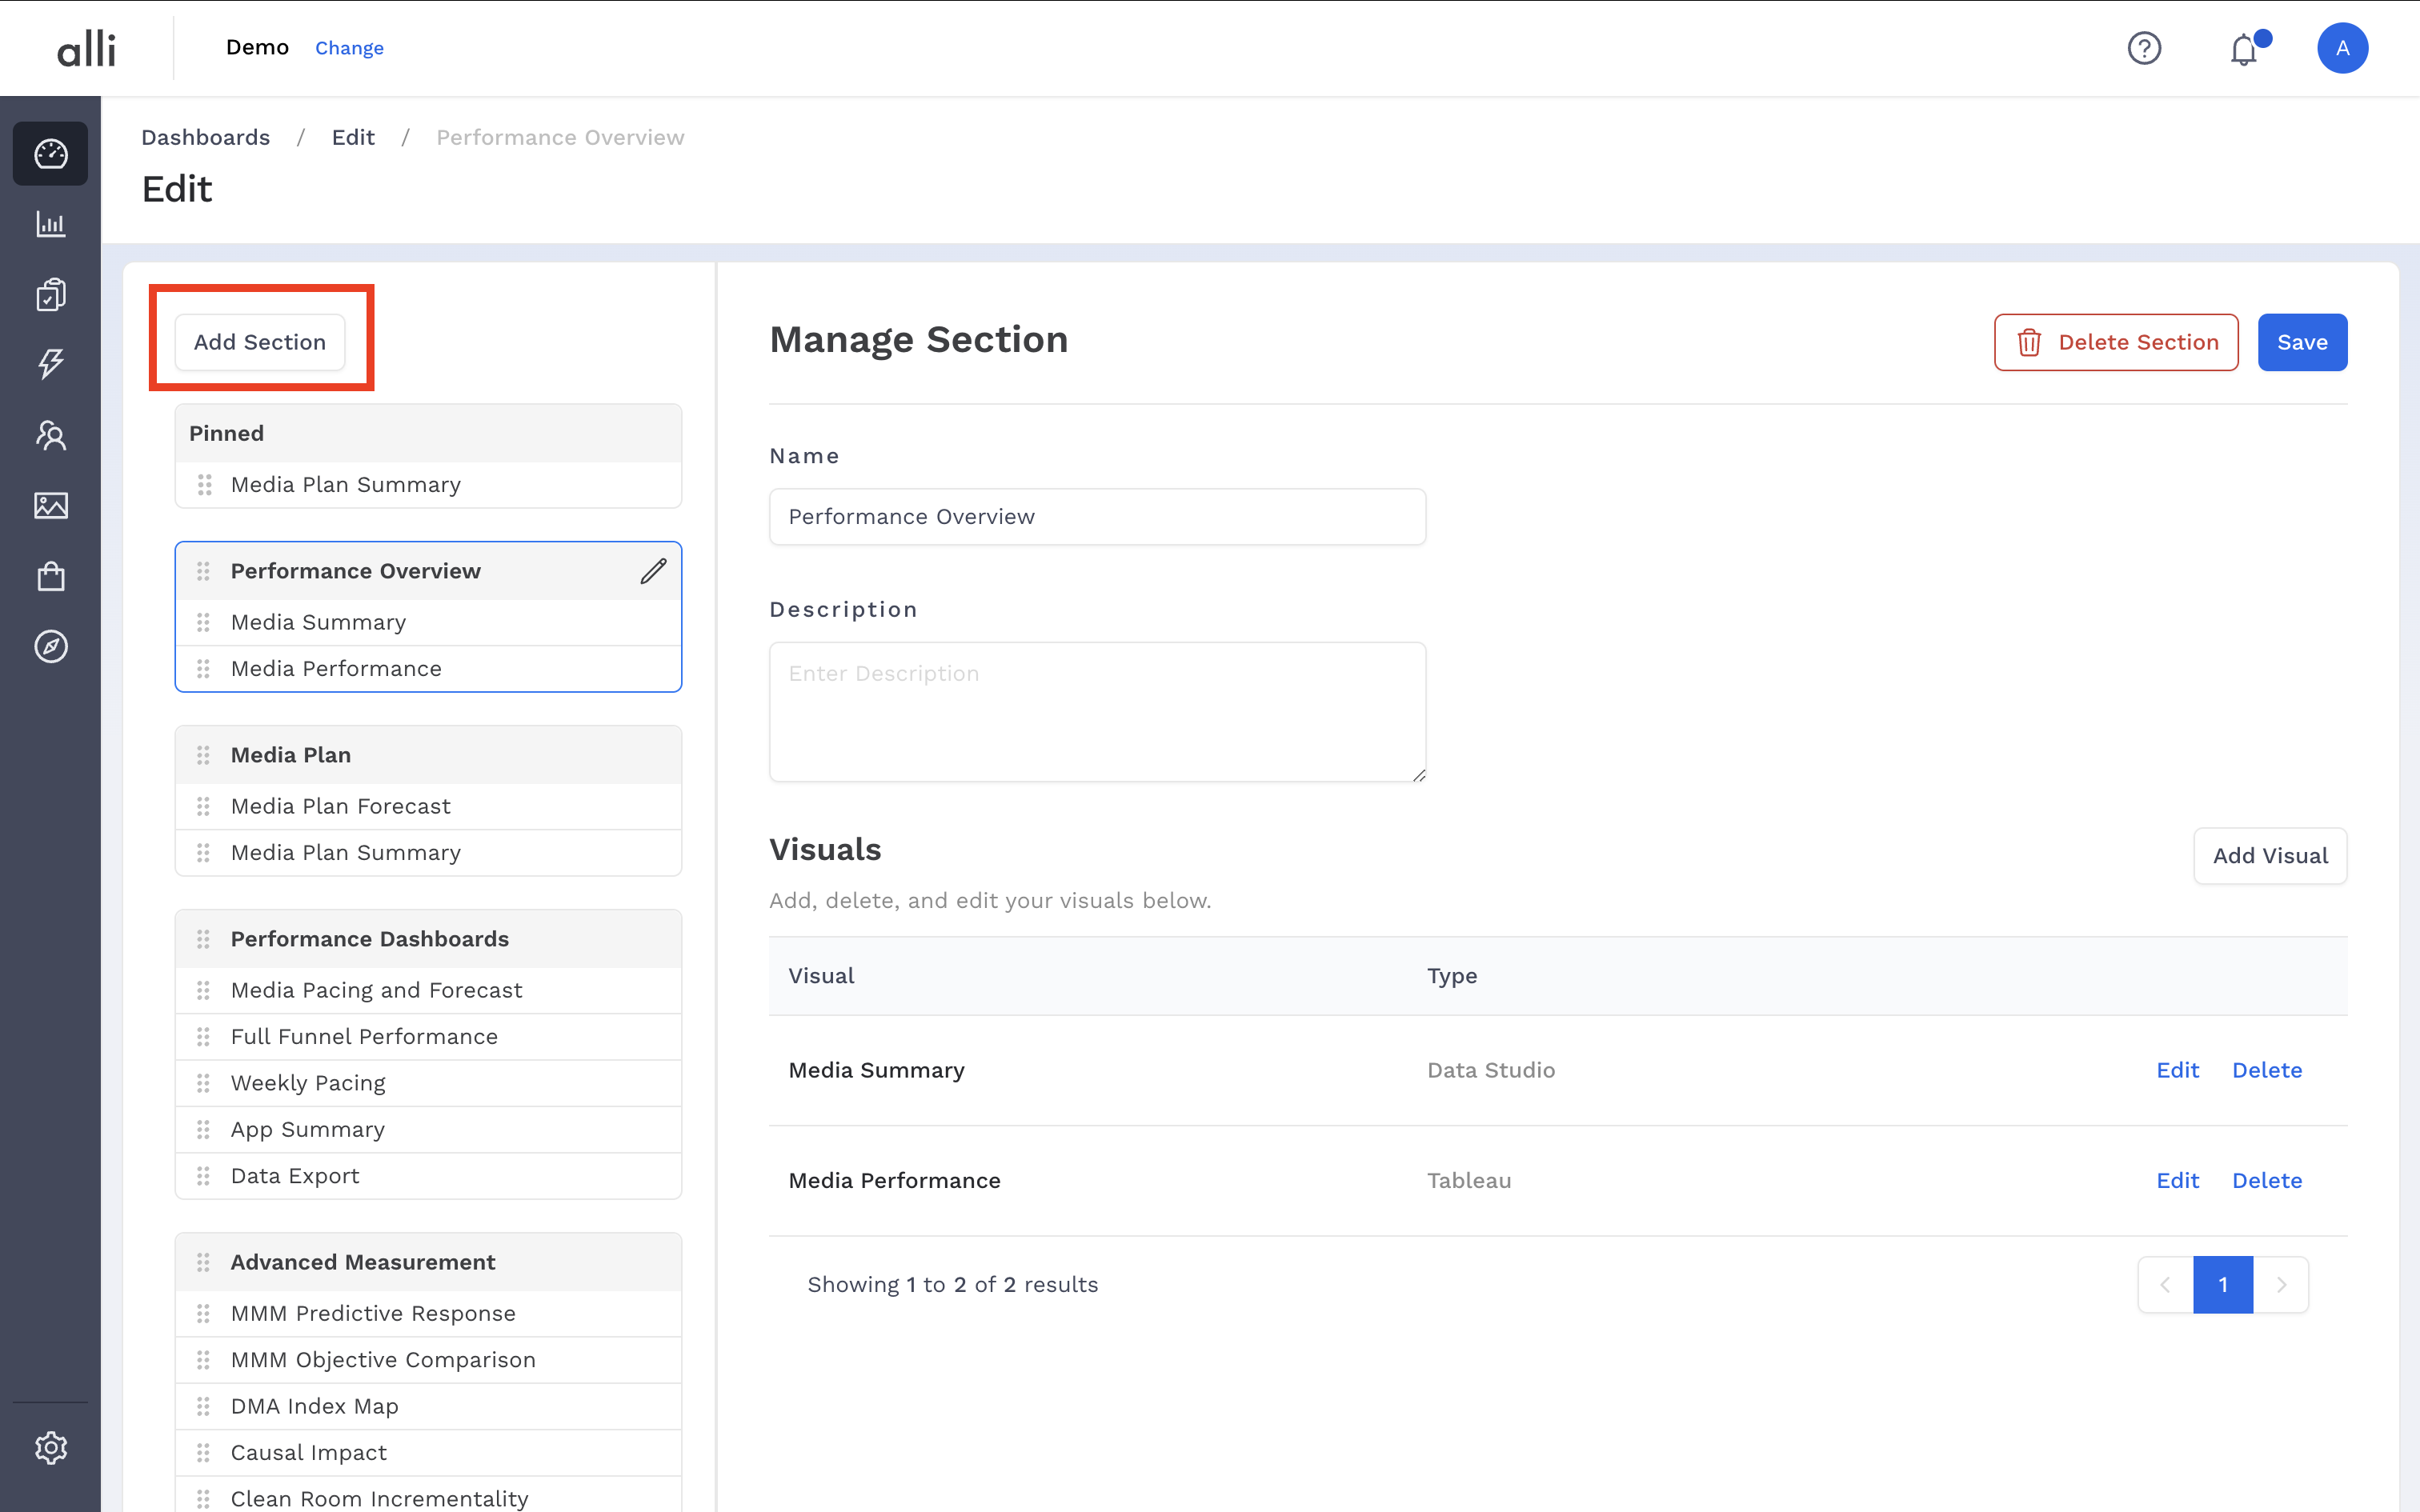
To create a new section in your client, click on the Add Section button in the Edit page highlighted in the screenshot below and insert a Name and Description for your section in the popup that appears.
Section Editor Page
The Section Editor page is where you can add visualizations into your section or edit an already created section’s name and description. You get to it by clicking on the pencil icon to the right of any already created section, or you will be sent there automatically upon creating a new section.
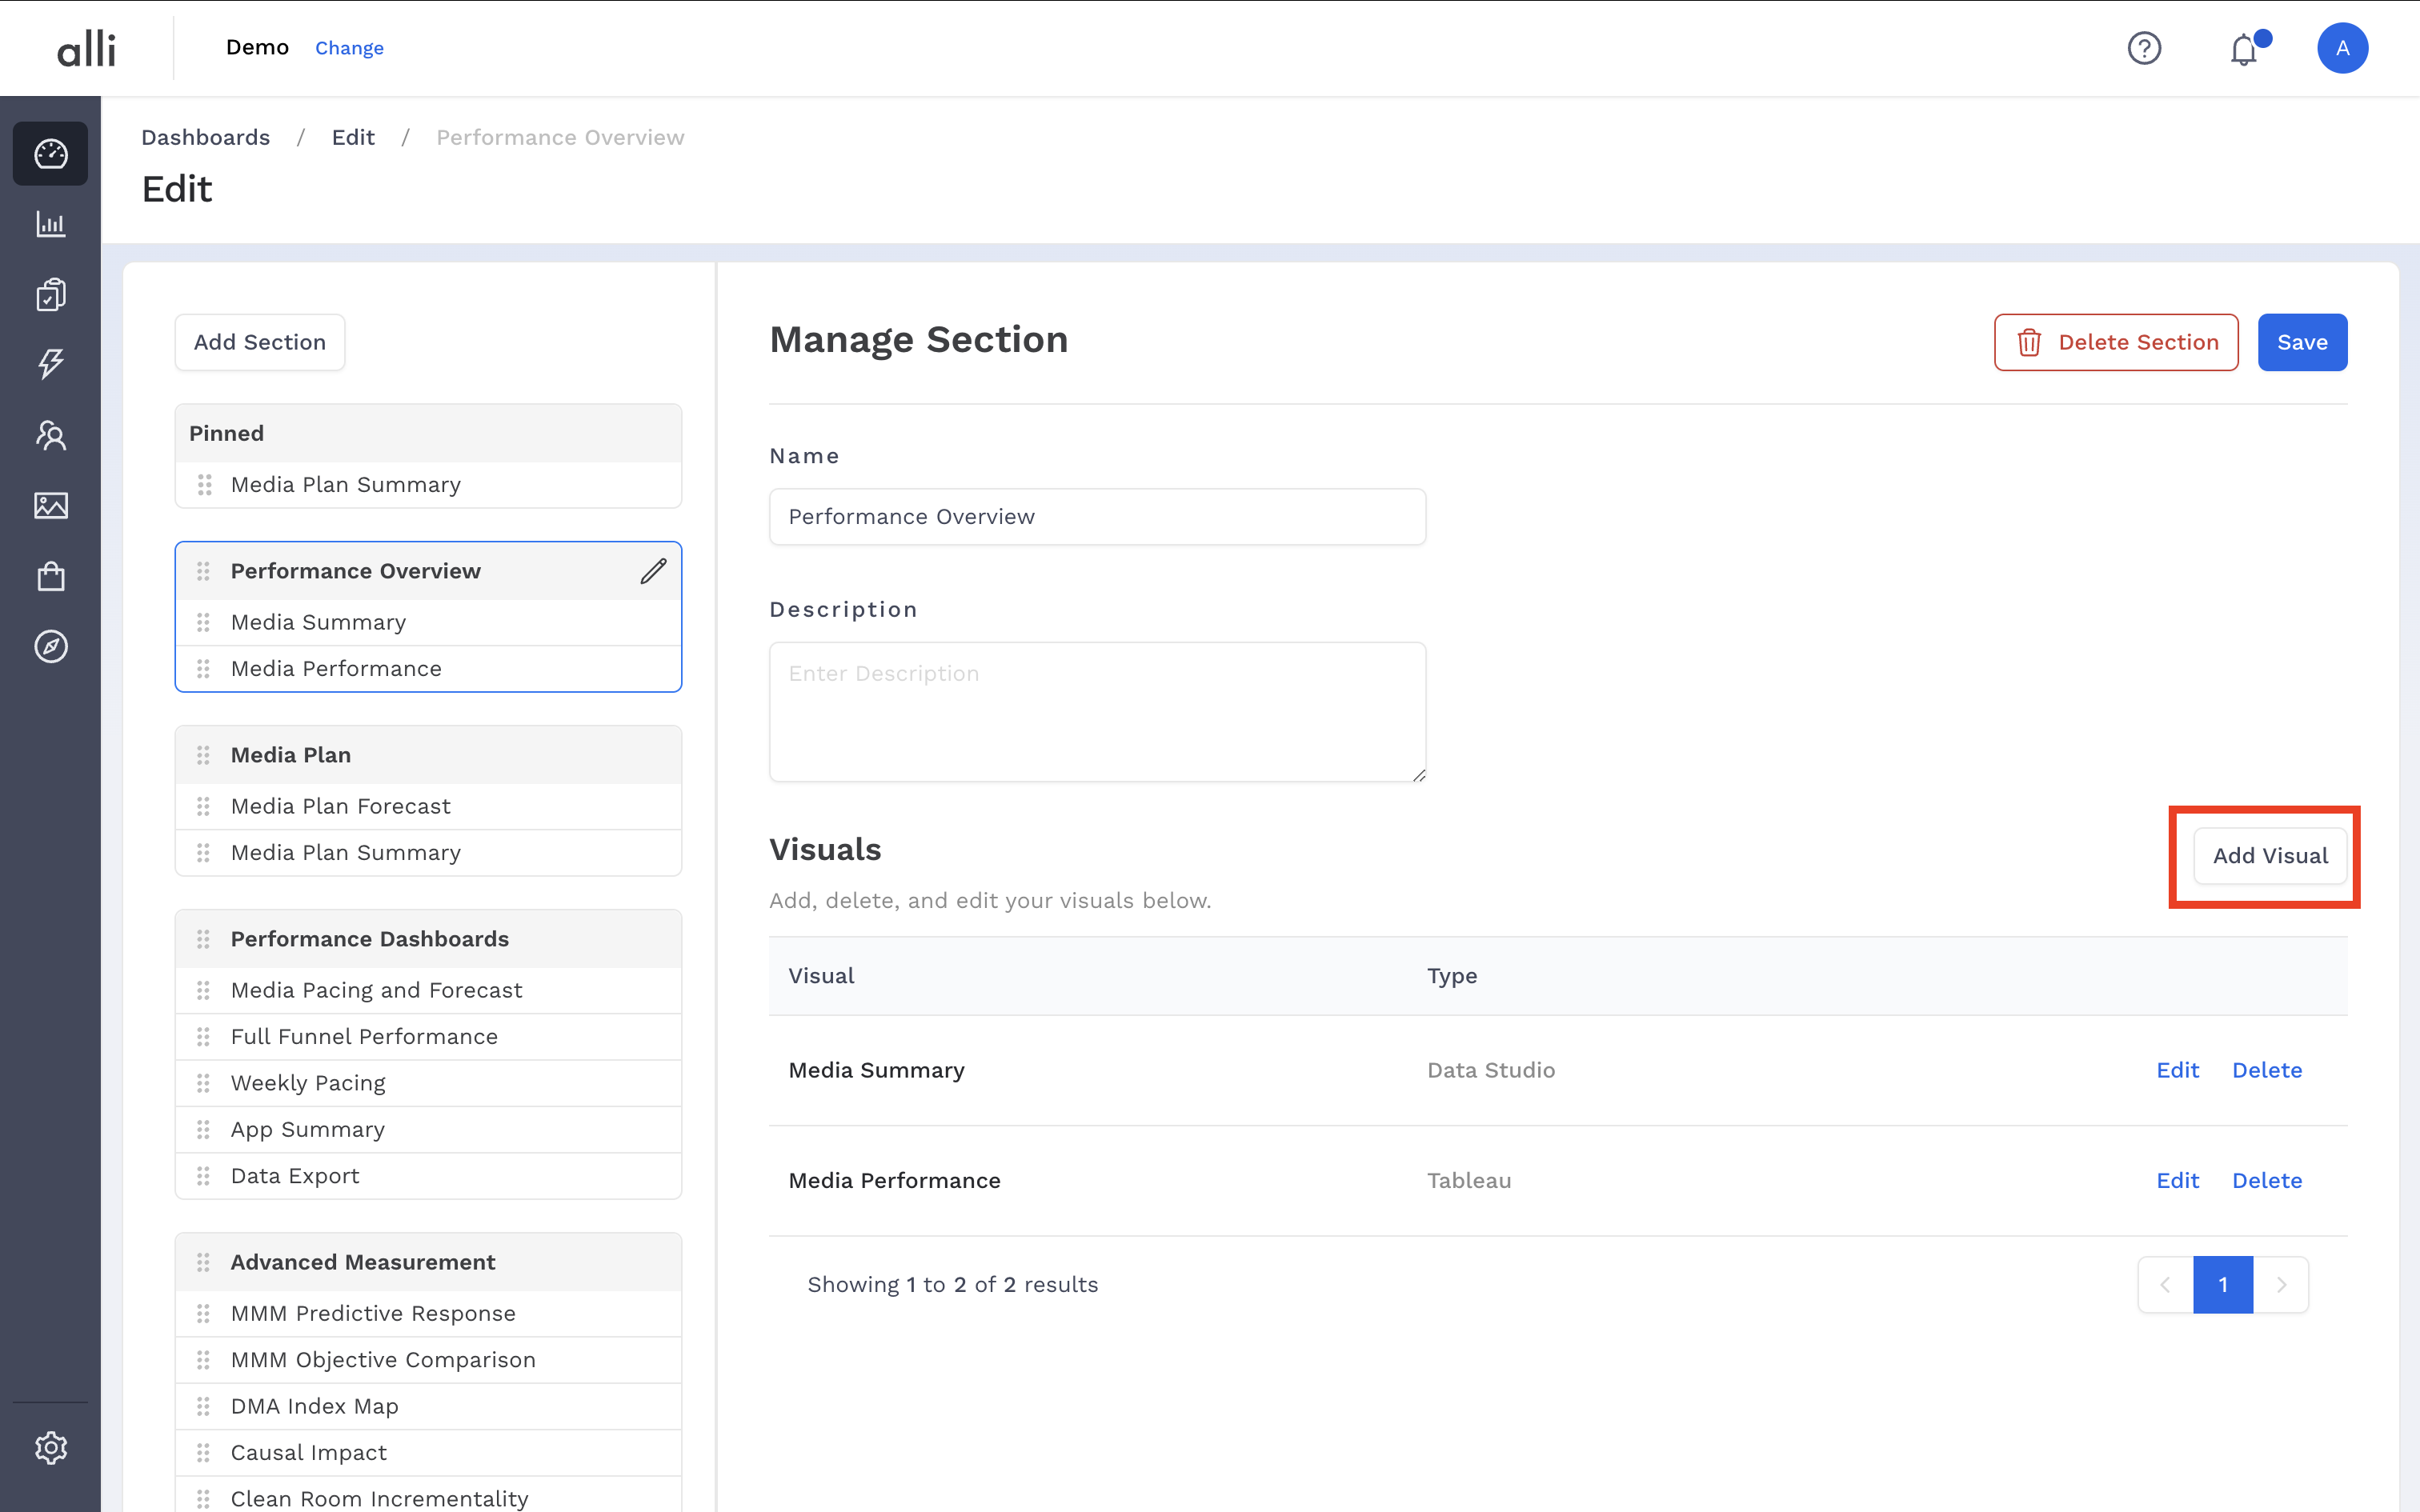
To add a new visualization, click on the Add Visual button, shown in the screenshot below.
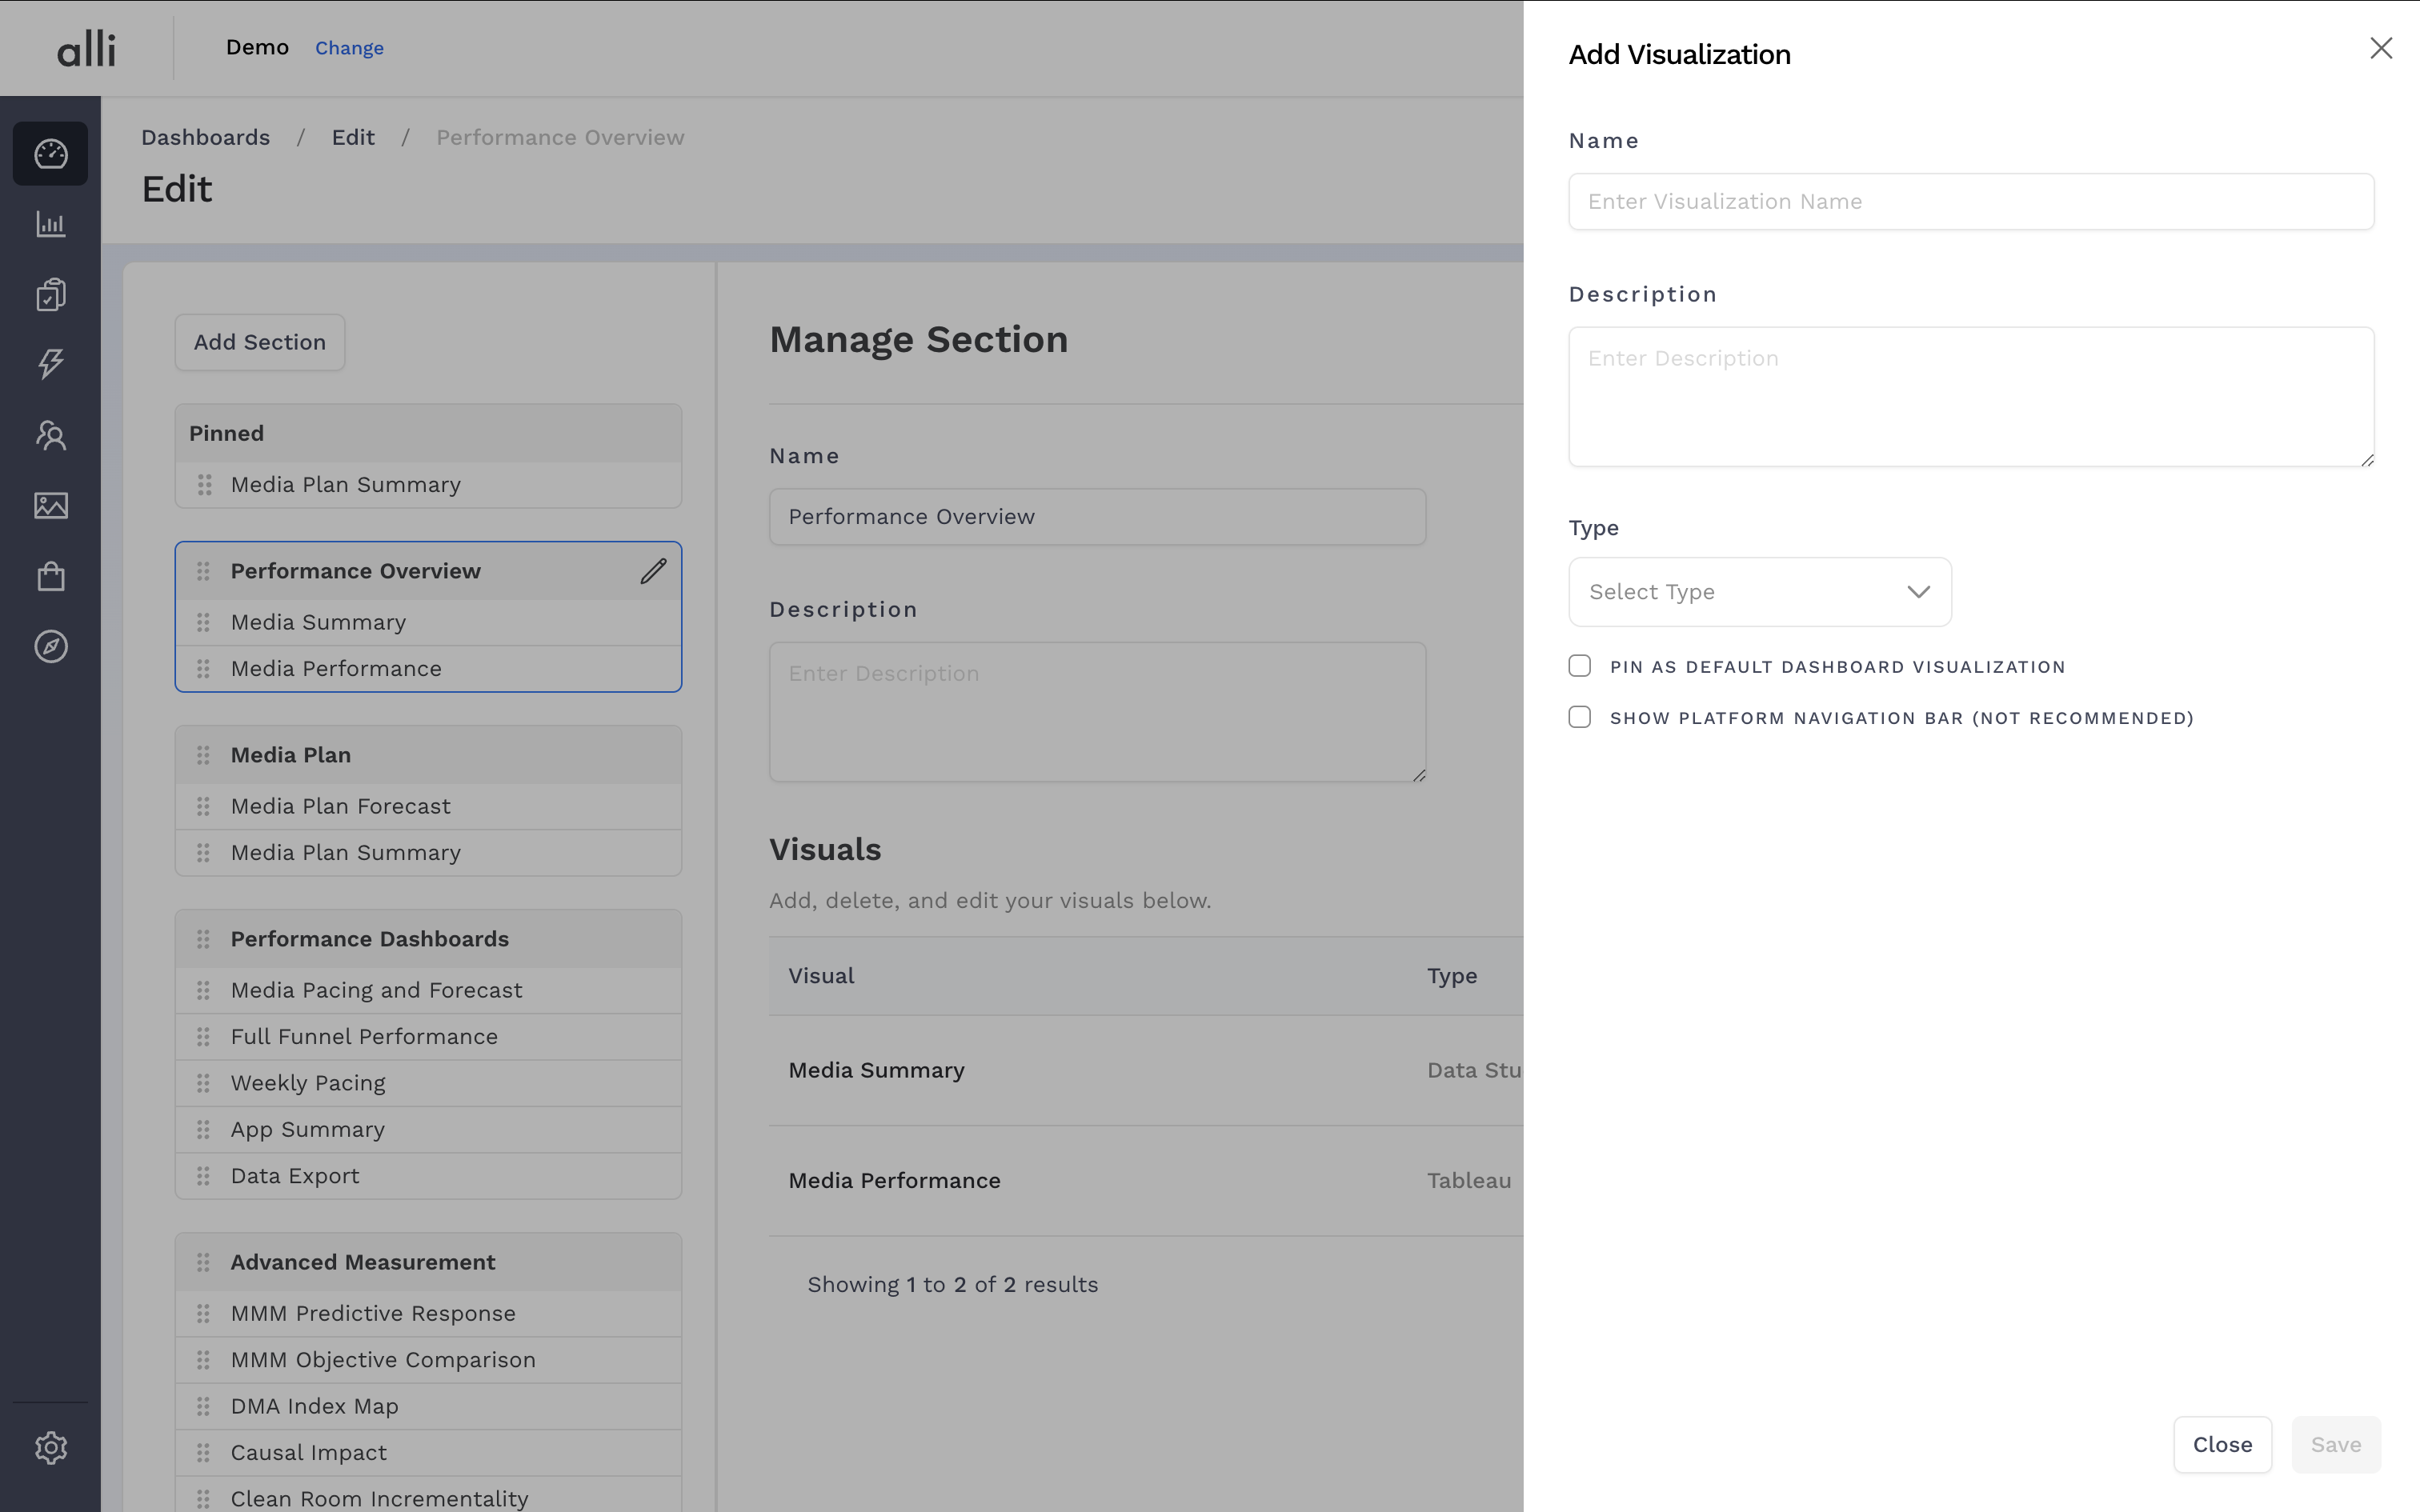
Visualization Editor Panel
This panel is where you can edit the visualization’s name and description, and where you will configure the remaining settings required for displaying your report.
You can go directly to an already created visualization’s edit page by clicking the edit button next to the visualization in the section editor page.
The first step in creating your visualization is to select the type of visualization you want to add to your Dashboard by choosing it from the dropdown menu next to “Type”. A helpful setup guide with step-by-step instructions will appear to the right of the configuration inputs.
Setting Up a Tableau Visualization
Tableau visualizations require a verified username with appropriate permissions for the Tableau View you would like to share, and the URL to the view from tableau.pmg.com. The steps to complete this setup are below:
Add a verified username to the input box marked "Tableau User".
Paste the view’s url in the input box marked "View URL".
(Optional) If you would like a link to this dashboard to appear at the top of the dashboard, click the "Pin in Dashboard List" checkbox.
Click the "Save" button to save your settings.
Setting Up a Data Studio Visualization
Data Studio Visualizations only require an embed code. The steps to complete this setup are below:
In Data Studio:
Click the "File" menu toolbar, and navigate to "Embed report".
Click the checkbox next to "Enable embedding" if it is not already checked.
Choose the button next to "Embed Code" and copy the code from the text box.
In the Visualization Editor page:
Paste into the "Embed Code" input box.
(Optional) If you would like a link to this dashboard to appear at the top of the dashboard, click the "Pin in Dashboard List" checkbox.
Click the "Save" button to save your settings.
Setting Up a Google Drive Visualization
Google Drive visualizations only require the url link to the drive file you wish to share. The steps to complete this setup are below:
In Google Sheets/Drive:
Share the sheet or drive file with the appropriate people.
Copy the url to the sheet.
In the Visualization Editor page:
Paste the URL in the "File URL" input box.
(Optional) If you would like a link to this visualization to appear at the top of the dashboard, click the "Pin in Dashboard List" checkbox.
Click the "Save" button to save your settings.
Setting Up an Excel Online/Office365 Visualization
Excel Online visualizations only require an embed code for the report that you wish to share. The steps to complete the setup are below:
In Office365:
Open the file in Excel Online for editing. (You should see the "File", "Home", "Insert", etc. menus at the top of the page.)
In the toolbar, open the "File" menu and navigate to "Share", and then click "Embed".
Select the appropriate options, and copy the "Embed code" near the bottom of the page.
In the Visualization Editor page:
Paste the copied embed code into the "Embed Code" input box.
(Optional) If you would like a link to this dashboard to appear at the top of the dashboard, click the "Pin in Dashboard List" checkbox.