This tools allows you to aggregate brand media flowcharts into one helpful view in Datastudio
If you have any issues, submit a service desk ticket
Get Started
This setup is reliant on a Alli Data report set up by the PMG analytics team.
Alli Marketplace App Setup
-
The Marketplace App is called
Brand Media Pacing Datastudio Dashboard -
There are five fields to fill out:
-
dcm_datasource
-
this is where you will put the analytics DCM datasource
-
i.e. public.al_{clientname}__display_dcm_placement_on_revenue
-
-
email_datasource_cost
-
This is where you will input the datasource that includes the emailed cost files
-
i.e. al_{clientname}.display_email_partner_cost
-
-
email_datasource_impressions
-
This is where you will input the datasource that includes the emailed impressions files
-
i.e. al_{clientname}.display_email_partner_impressions
-
-
flowchart
-
This is where you will upload your brand’s flowchart, following the same column structure in the following google sheet: https://docs.google.com/spreadsheets/d/1MQTpVcGLHHZARrawt-G-L-ko3wRbrK91XyXxSkp7BIc/edit?usp=sharing
-
-
-
project_name
-
This is where you will name the file you’re uploading
-
ie.) {clientname}_Flowchart_(Current Date)
-
Alli Data data source setup
Once you save & run the Alli Marketplace App, the aggregated data gets sent to an s3 bucket. In order to access the aggregated data in Alli Data, complete the following:
-
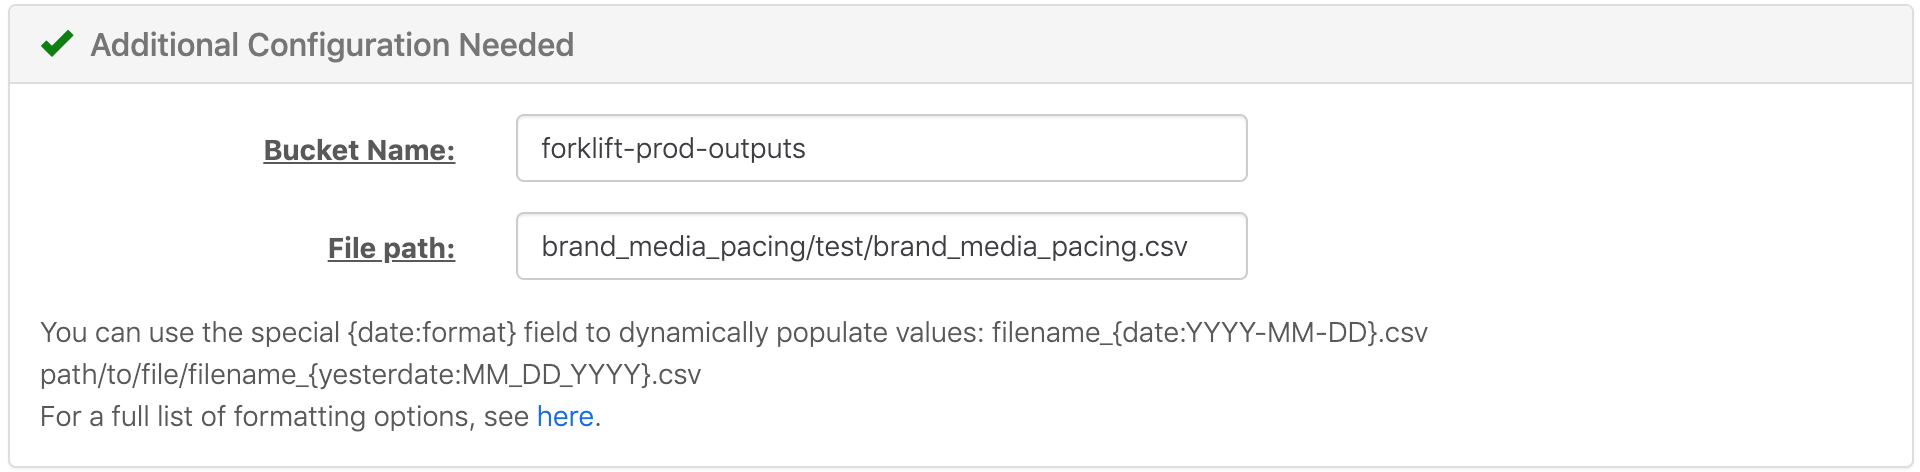
Create a new s3 datasource in Alli Data
-
Input the following fields accordingly:
-
-
Run the following SQL in Alli Data Reporting → Explorer using the “Custom Redshift” report type to download the csv file, and drag it into the “Define Your Data” section:
-
SELECT * FROM {clientname}.brand_media_pacing
-
-
Finally, save the datasource, and click on load data.