
Overview
The Google Search Console datasource allows you to pull performance data from the Google Search Console API. This is more data than is available in the Google Search Console UI.
|
Vendor/Partner |
|
|---|---|
|
Version |
Google Search Console webmasters v3 |
|
API Documentation |
|
|
Sunset Date |
None as of 10/29/2025 |
|
Channel(s) |
Search (organic) |
|
Refresh Time (CST) |
3am |
|
Default backfill |
3 days |
|
Alli Data Library |
|
Getting Started
Before getting started with the Google Search Console datasource, ensure your Google account has either owner, full or read access to the relevant property you want to pull data from.
Authorization
Click the button to login to your Google account and provide Alli access your Google Search Console properties.
Additional Configuration
Select the relevant site name from the list. You can select multiple sites by holding down CTRL or CMND on your keyboard.
Then, select the relevant dimensions you want to include in your report.
Note, the combination of dimensions you select will affect the overall totals that you see when aggregating the data. These can sometimes differ significantly from the totals you see in the Google Search Console UI. For an explanation of this, please see the ‘limitations’ section further down the page.
Define your Data
Dimensions
|
Name |
ID |
Type |
Description |
|---|---|---|---|
|
Date |
|
Date |
This is a required dimension. |
|
Site URL |
|
String |
The URL of the property as defined in Search Console. Examples: |
|
Country |
|
String |
A 3-letter code for the country in which the searches took place. |
|
Device |
|
String |
The device used for the search, either: desktop, mobile or tablet. |
|
Page URL |
|
String |
The URL for the page that showed on the SERP. |
|
Search query |
|
String |
The query that the users searched for us to show on the SERP. |
Metrics
|
Name |
ID |
Type |
Description |
|---|---|---|---|
|
Clicks |
|
Number |
Click count for the row. |
|
Impressions |
|
Number |
Impression count for the row. |
|
Click-through rate |
|
Number |
Click Through Rate (CTR) for the row. Values range from 0 to 1.0, inclusive. |
|
Average position |
|
Number |
Average position in search results. |
Limitations
Google Search Console provides varying totals, depending on what combination of dimensions are selected. In general, you should use the fewest possible dimensions for your datasource’s purpose.
To illustrate how these totals can vary, see the totals for one month of a client’s data:
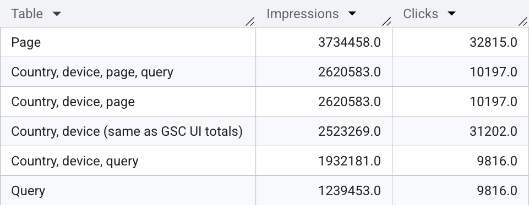
Any data that includes 'query' as a dimension will automatically reduce total impressions and clicks. This is because Google anonymises some data to reduce the likelihood of users being identifiable. Without other dimensions, it also has a 5k rows per day limit.
Including 'page' as a dimension will increase total impressions and clicks. This is because multiple pages appearing for a single search won't be deduplicated in the results, meaning one search can result in multiple impressions and clicks. It also uses page aggregation, which allows more rows to be returned from the API.
Including 'country' and 'device' as dimensions will sometimes increase or decrease total impressions and clicks. When paired with the 'query' dimension, it further anonymises impressions. However, it can increase total impressions through its higher daily row limit - 50k vs 5k for the query dimension alone. It's very hard to predict what effect this will have, as it depends on the number of unique countries you show in and the number of unique queries in a given day.
"I just want totals that match the UI”
-
Country, device - top-level totals
-
Query - individual queries
-
Page - individual pages
"I want to see as many rows as possible"
-
Country, device, query - unique queries
-
Country, device, page, query - page and query combinations
Querying with regex
The Reports view in Alli doesn’t currently support using regex for filtering but you can do it using simple SQL that you can copy and paste then adjust. Just go to Reports > New Data Report > Edit Custom SQL. Using the SQL below, replace ‘porthaven_care_homes’ with your client name in the same format (you can find it in the URL when you’re in Alli) and replace ‘googlesearchconsole_insights_webcountrydevicepagequery’ with the table name you want to query.
SELECT
    *
FROM
    porthaven_care_homes.googlesearchconsole_insights_webcountrydevicepagequery
WHERE
    REGEXP_CONTAINS(page, r'[INSERT REGEX HERE]')
Average position
When working with Google Search Console data, bear in mind that the average position metric will not aggregate logically by default, in most scenarios it will just sum them. For this reason, it’s best to use the datasource with only the dimensions you need for your specific reporting purpose.
Otherwise, you’ll need to create a total_position column in SQL that multiplies the average position by the number of impressions for each row and then, in the reporting context (such as Looker Studio), create a calculated field that divides that by the number of impressions to get the accurate average position for that combination of dimensions.
SELECT
  * EXCEPT(position),
  position * impressions AS total_position
FROM
  porthaven_care_homes.googlesearchconsole_insights_webcountrydevicepagequery