
Onboarding Vistar DSP to Data Library
Prerequisites
User creds with access to client Vistar DSP account
A shared [client]_reporting@pmg.com account is preferred over a personal account
Creating the Vistar DSP report
Log into the Vistar UI using the user creds that has access to the client’s Vistar DSP account
If it is a shared multi-account login, select the appropriate account:
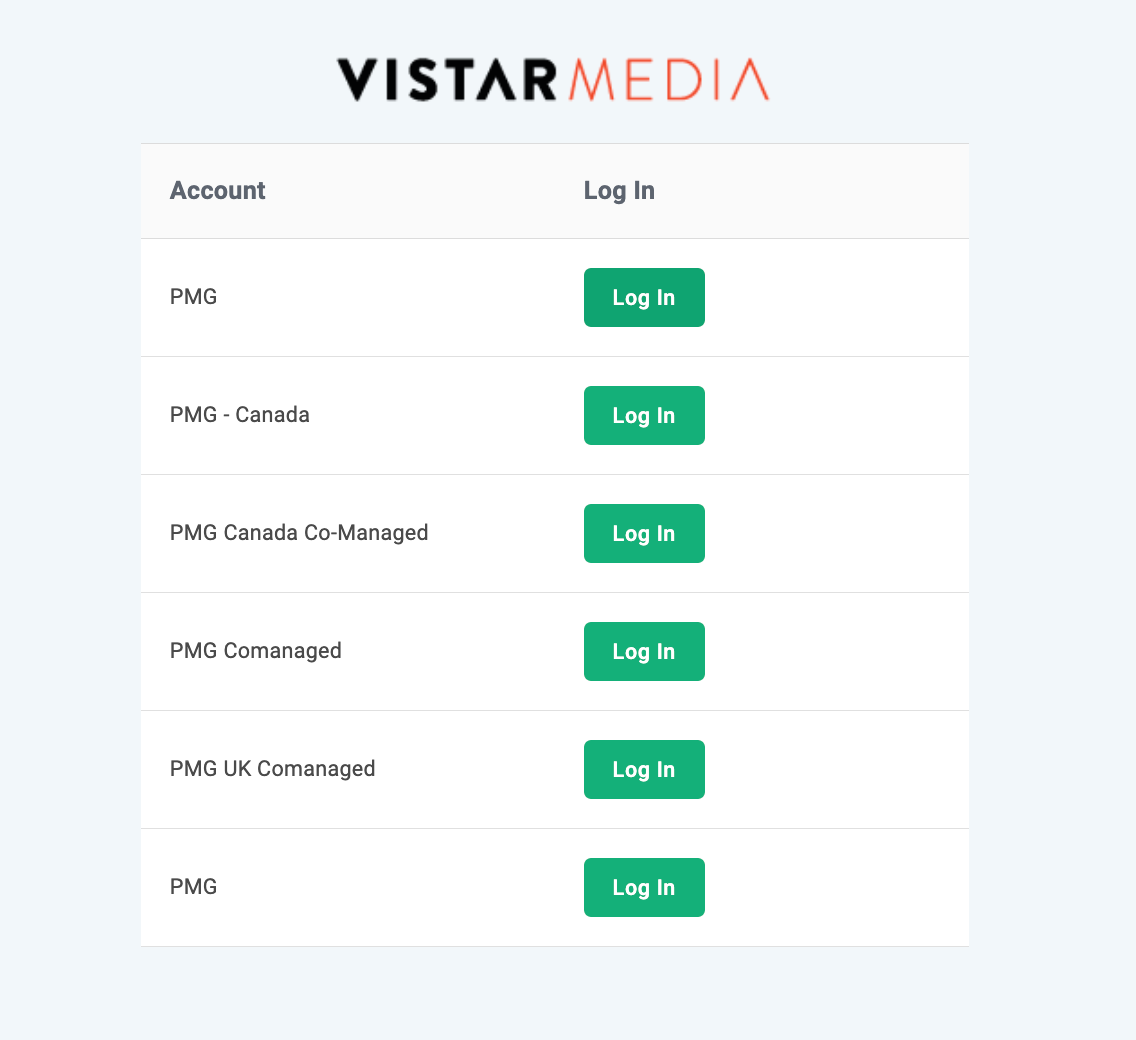
After successful login to the expected account, navigate to the Reporting section:
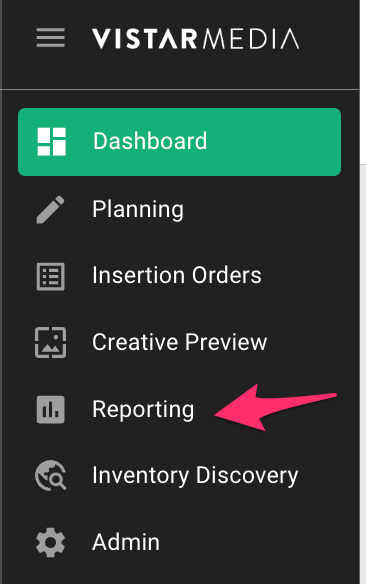
Click on “Add Report” to create a new report:
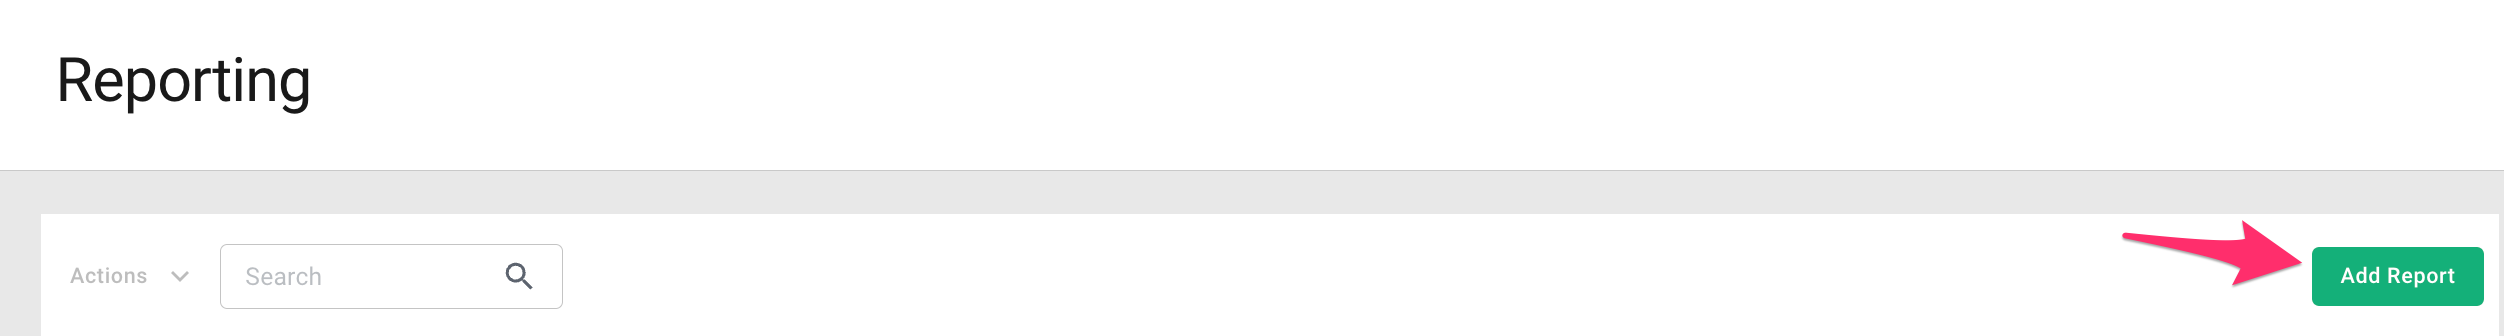
Build out the report with the following criteria:
Date Range -
Last 7 DaysTime Zone -
DefaultFilter -
Select the advertiser you wish to create report for (i.e. Athleta, Shake Shack)Group By: Select the columns checked in below screenshot! Select
"Day"as theDate Interval
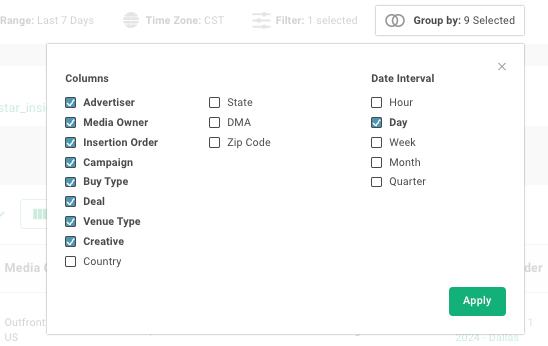
Click
Load ReportAdd
Spotsin to metrics selection by clicking onMetrics: 1 removed, checking it and then clicking Apply:
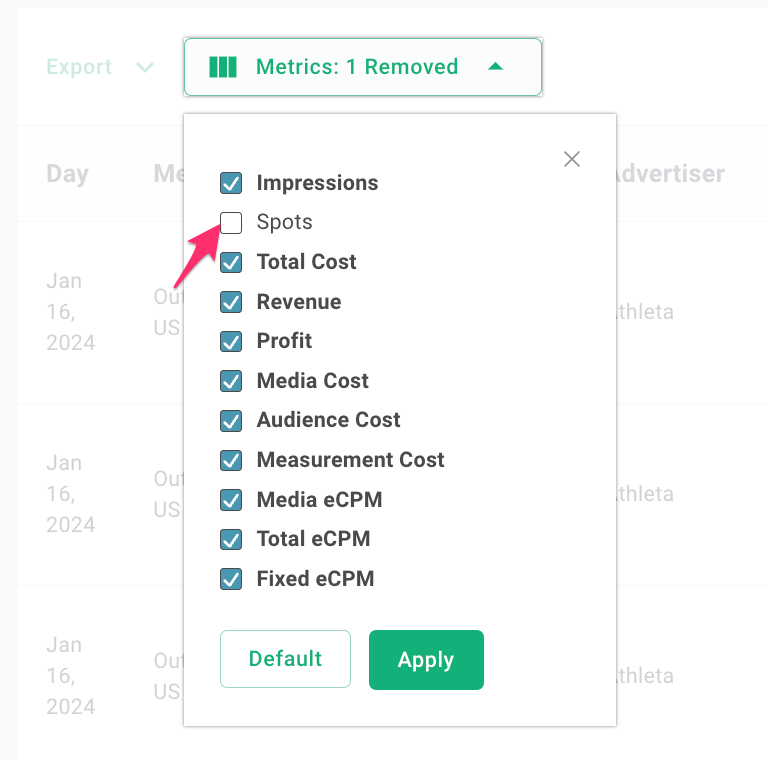
With all of the columns selected and all metrics checked, click
Save ReportReport name -
ADL - vistar_insights_ad - {client_name}Public -
check if you wish for it to be available to all users under accountClick Save.
Creating and Backfilling the datasource
Open the
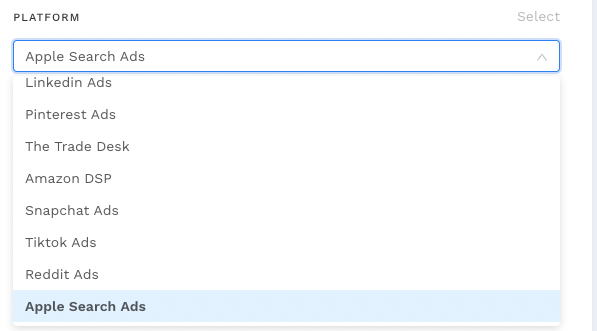
Alli Data Library 2.0 - Onboard Platformapp or install it if it is not already available for your client in Alli Data (follow this section Onboarding a platform to Data Library | Creating-your-datasources-using-Alli-Marketplace for detailed instructions)Create the Vistar datasource by selecting the
Vistar DSPoption under platform dropdown and execute theAlli Data Library 2.0 - Onboard Platformapp.
Locate the datasource that was created
Authenticate datasource using the Vistar DSP Reporting UI creds.
Select the report you created using the previous steps above (
ADL - vistar_insights_ad - {client_name}):
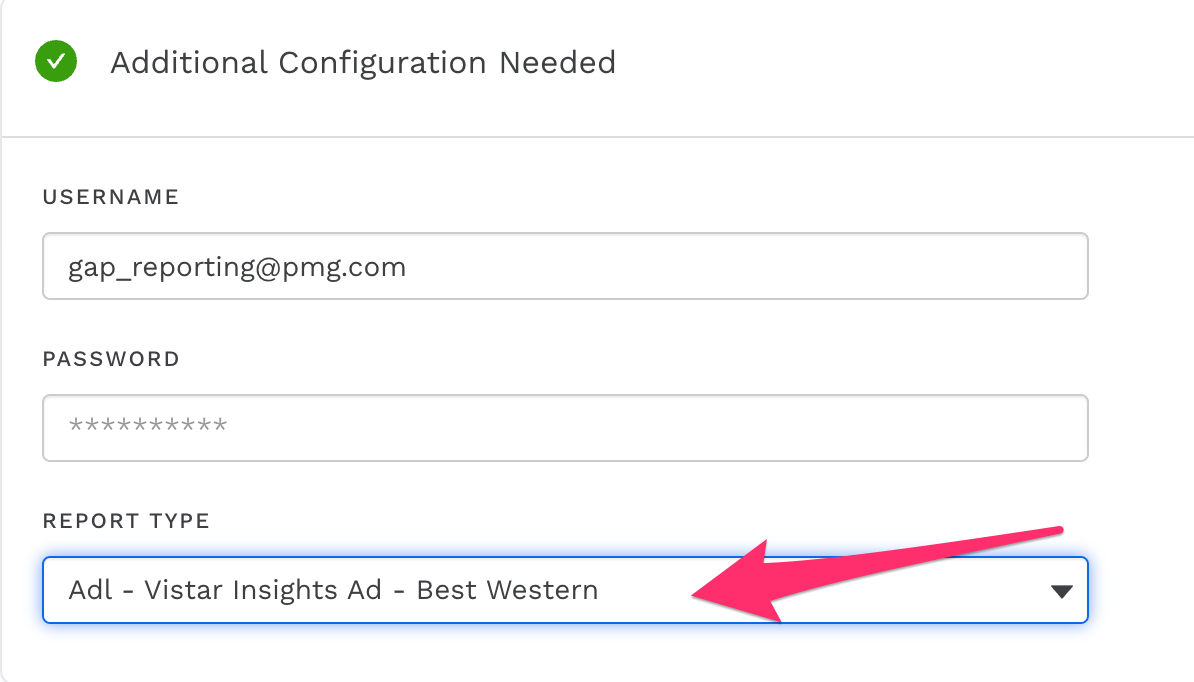
Click on Save.
To backfill, you can use the Load Data API feature by selecting a date range and then clicking
Load Data: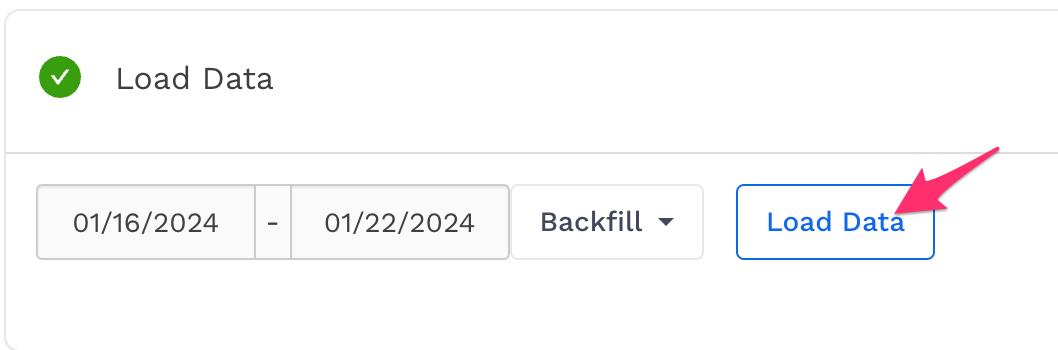
To refresh the Data Library report after successful backfill, use the
Alli Data Library 2.0 - Refreshapp:If the app is not already installed, follow the steps in this document (Building and refreshing a Data Library report ) to install, configure, and execute the Refresh app as n
If the
Alli Data Library 2.0 - RefreshMarketplace app exists for your customer, add the following variables to thedbt_vars.jsonfile and trigger the App to build the Vistar DSP report for your client:
"data_library_vistar_enabled": "True"