Overview
Once your media plan is created, you can bring it to life using visuals. Visualizations make it easier to understand budget allocations, spot trends, and share insights across teams.
Any plan can be used in the Overview visuals regardless of status. However, Clients only have visibility into views that do not contain a plan in Draft. Learn more about plan statuses and user roles here: https://agencypmg.atlassian.net/wiki/x/m4L1BAE
Overview visuals are limited to Admin Columns only. If you do not see any dimensions or metrics available to select, ensure that the client owner has configured admin columns for use across all plans in the client. How-To: Create Admin Columns
Instructions
-
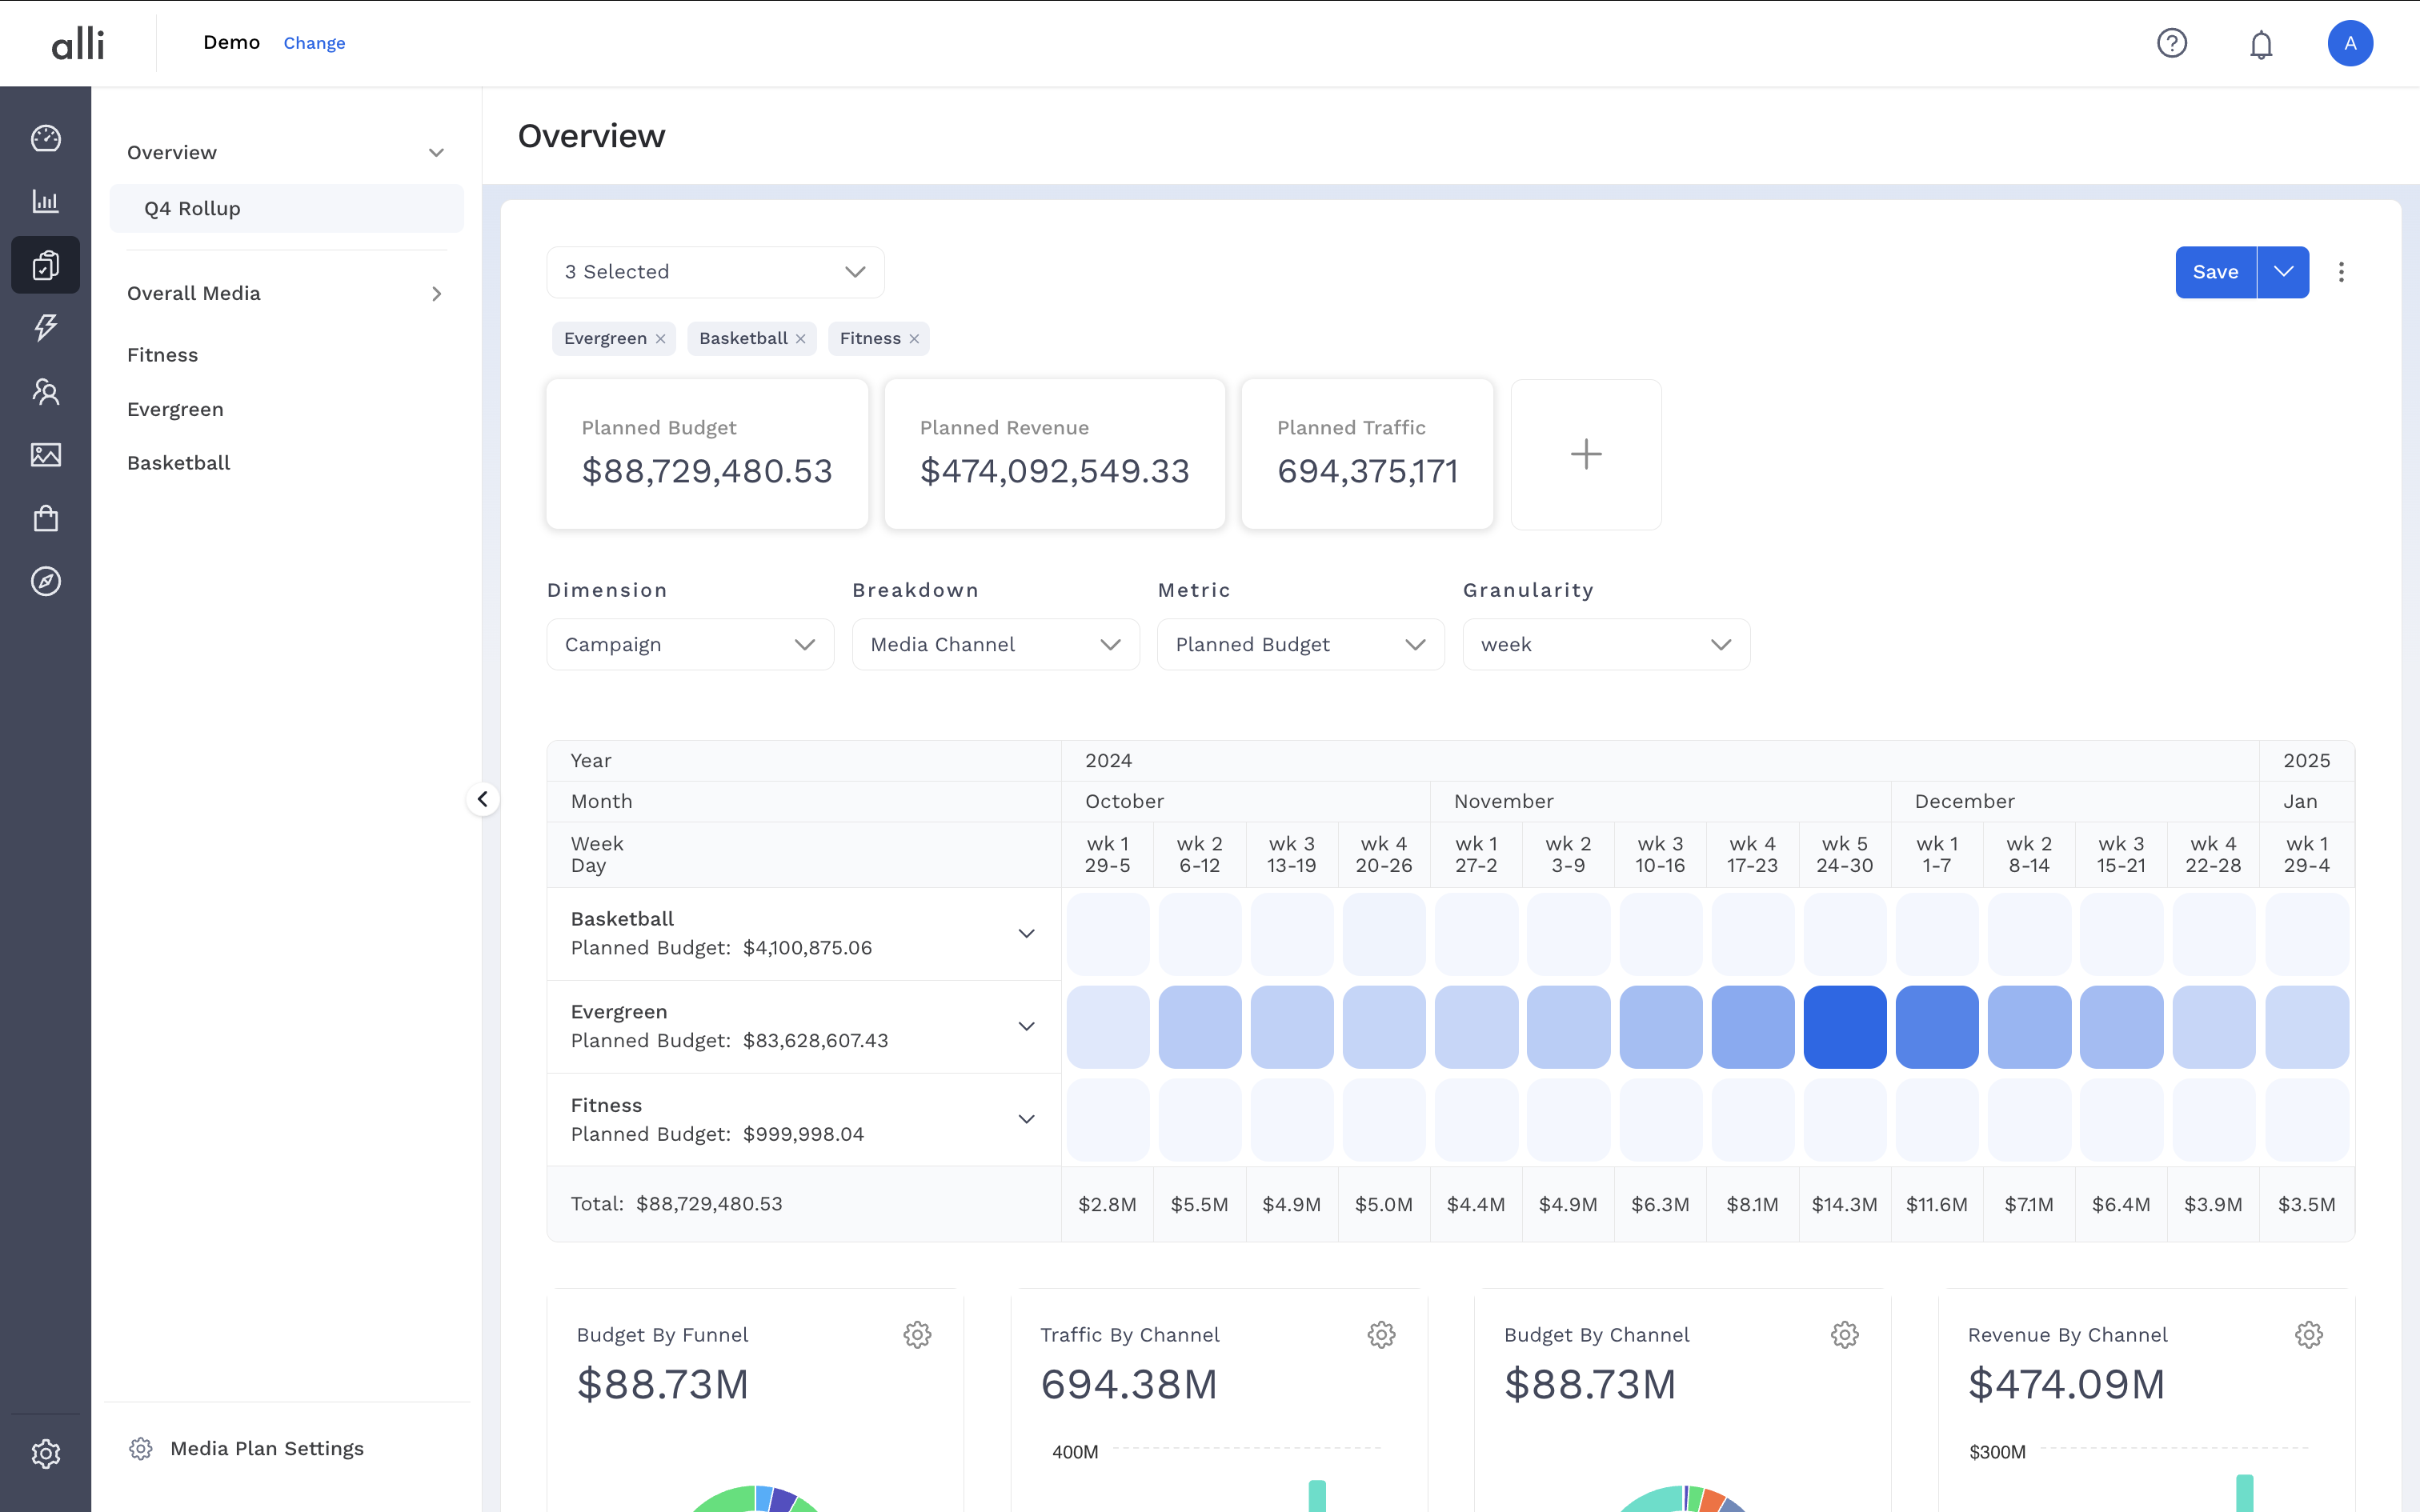
Navigate to the Overview section by going to: Planning & Strategy → Media Planner and select one or multiple plans to visualize.
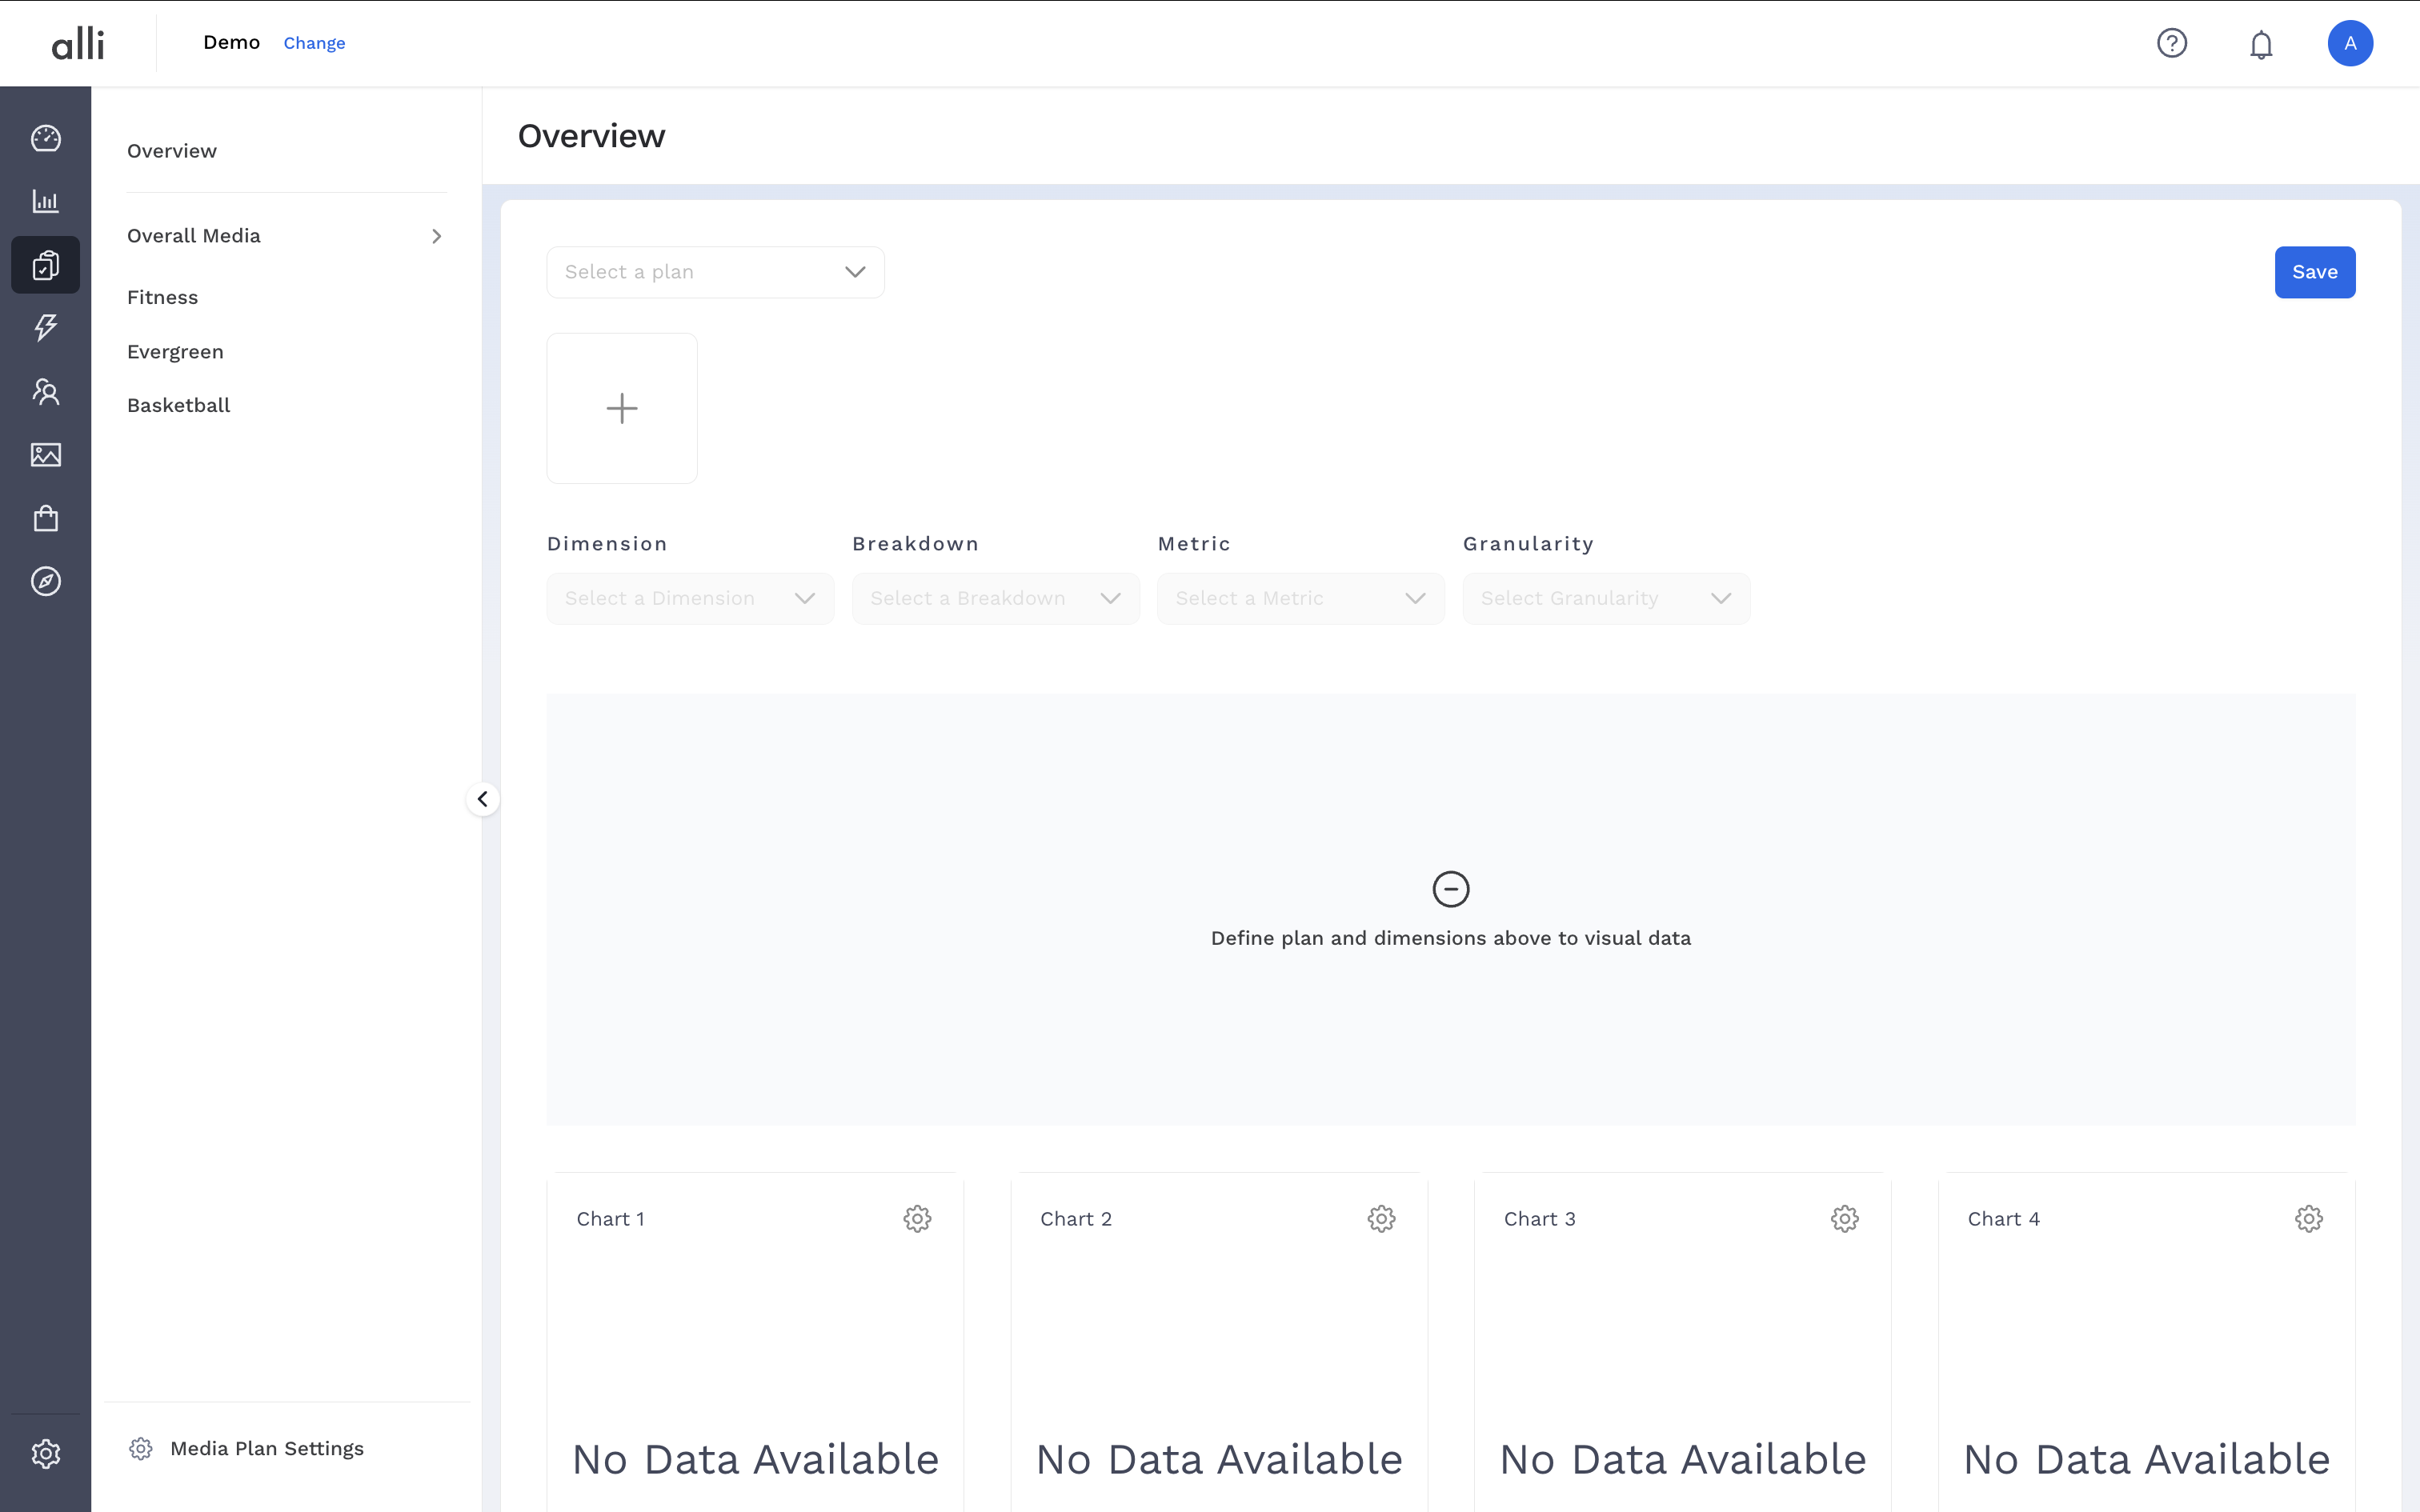
-
Add in key high level metrics by clicking the “plus” button.
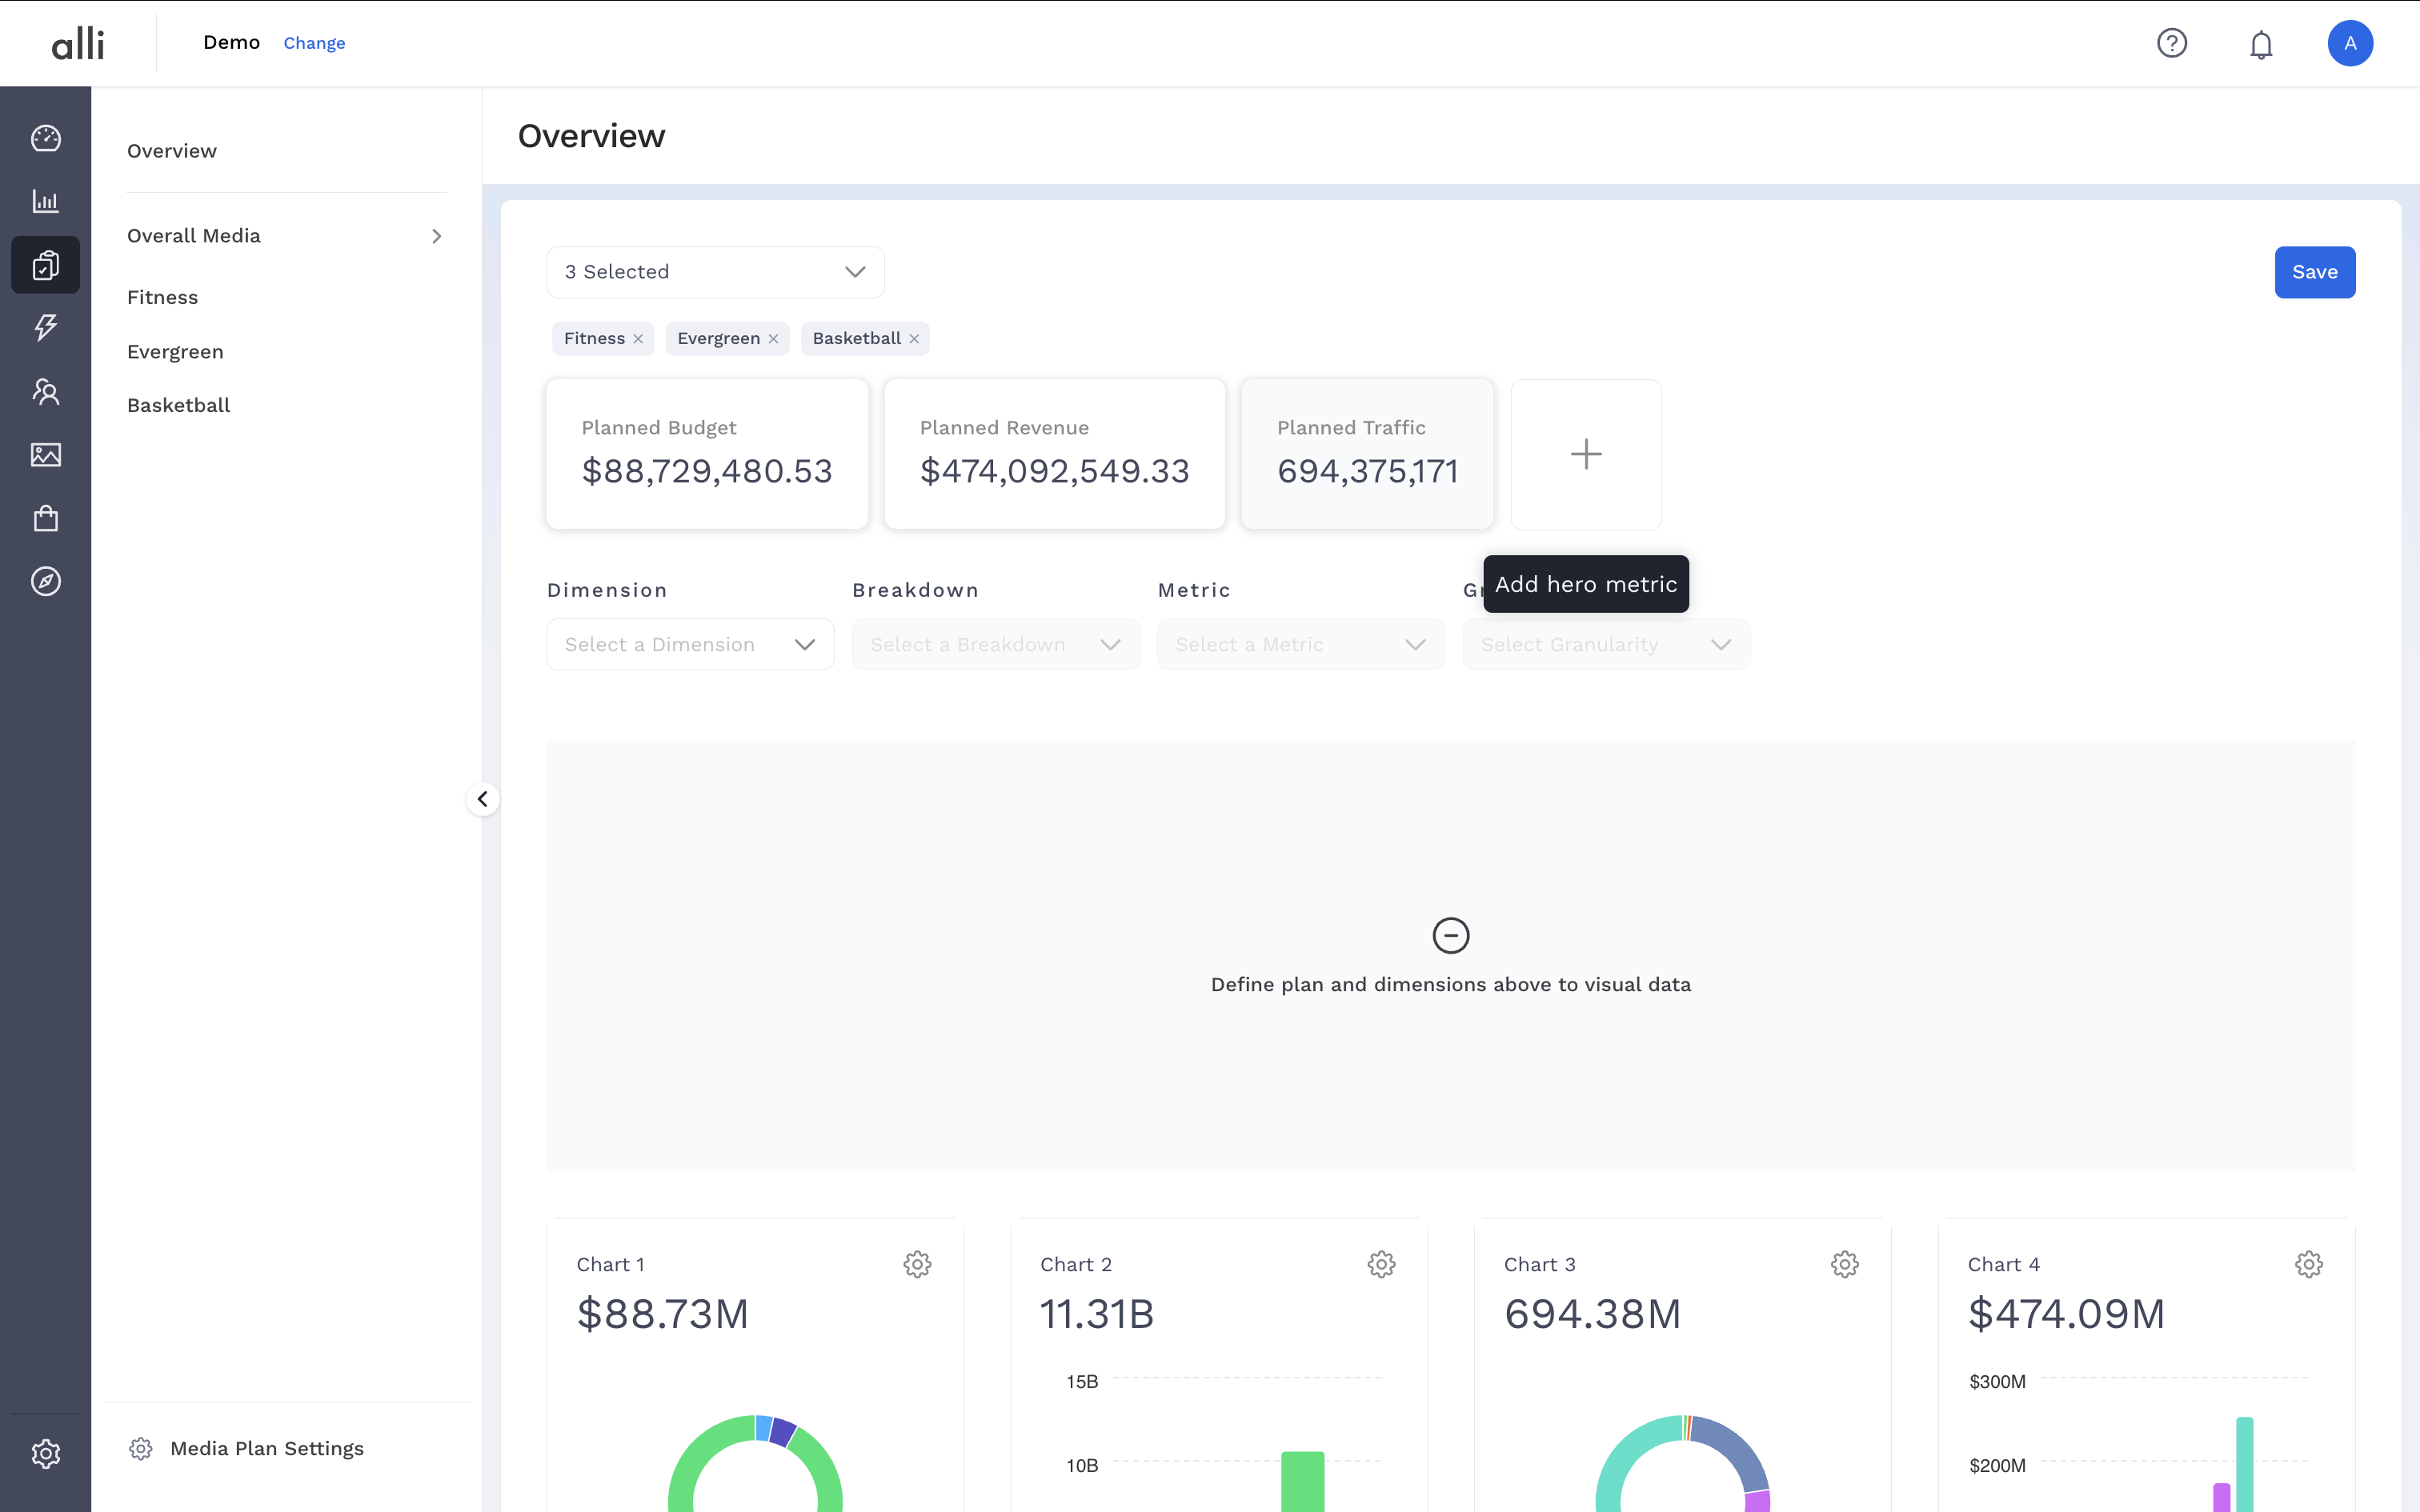
-
Set up the flowchart by selecting inputs from the drop down menus
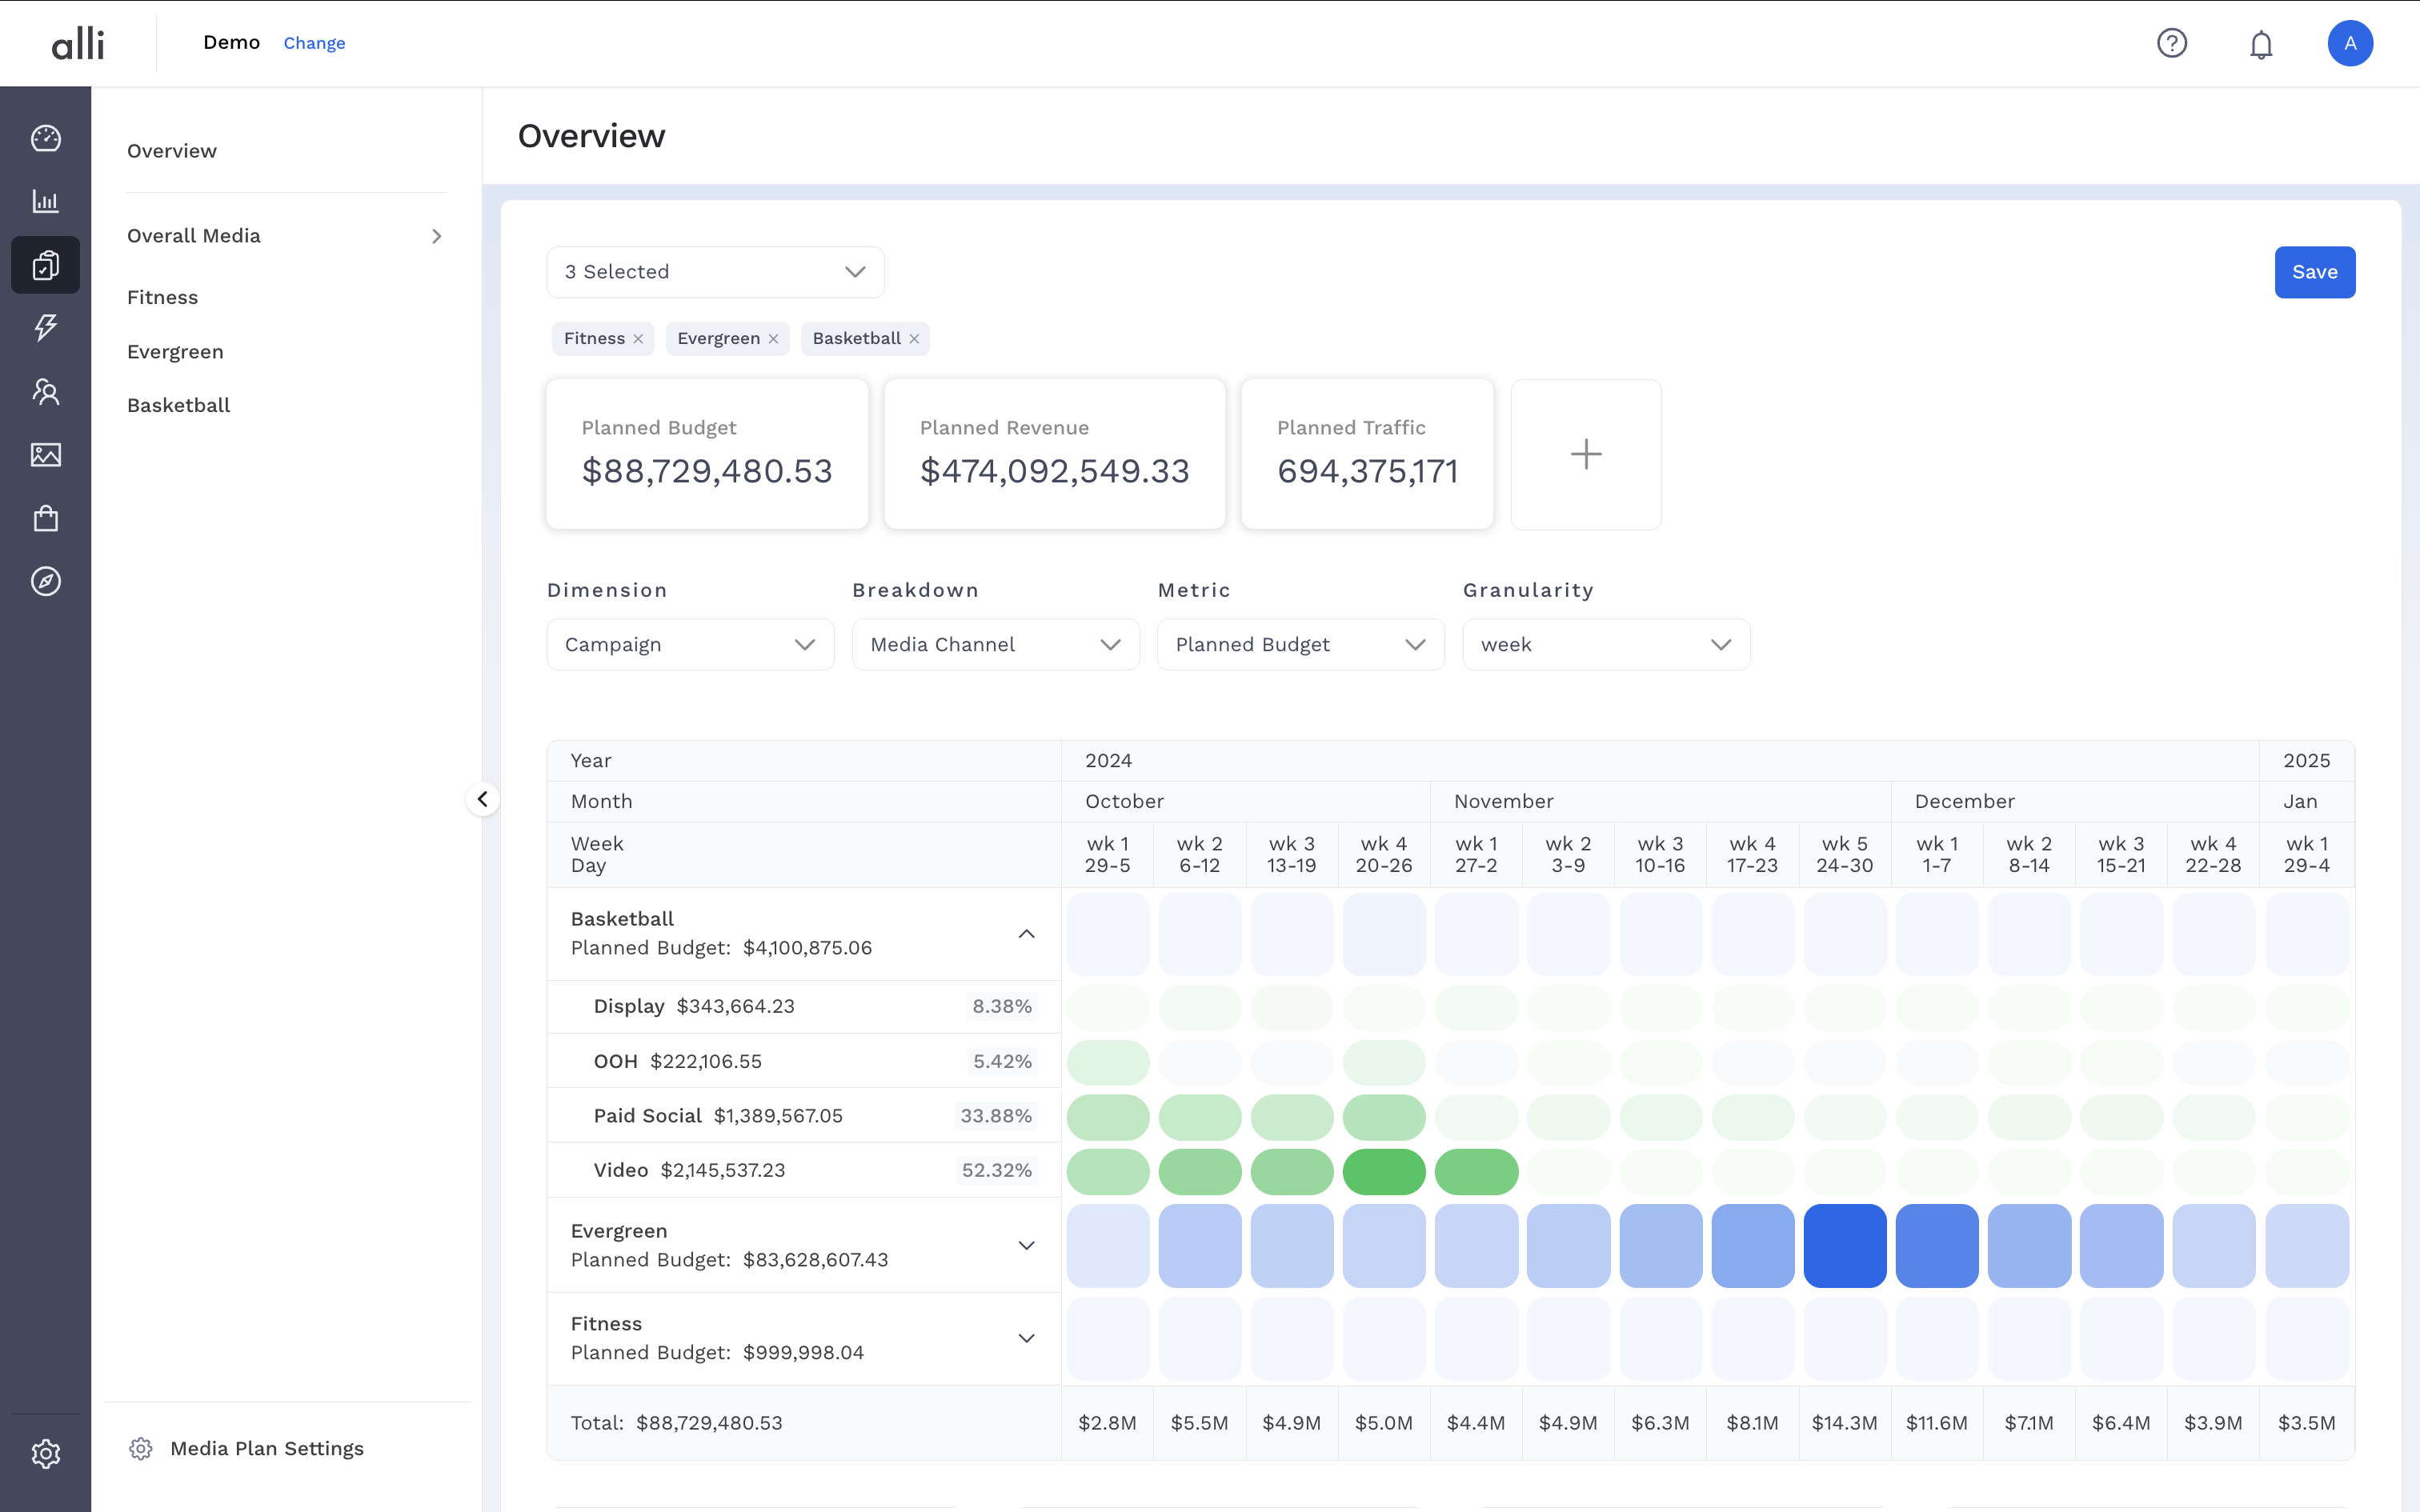
-
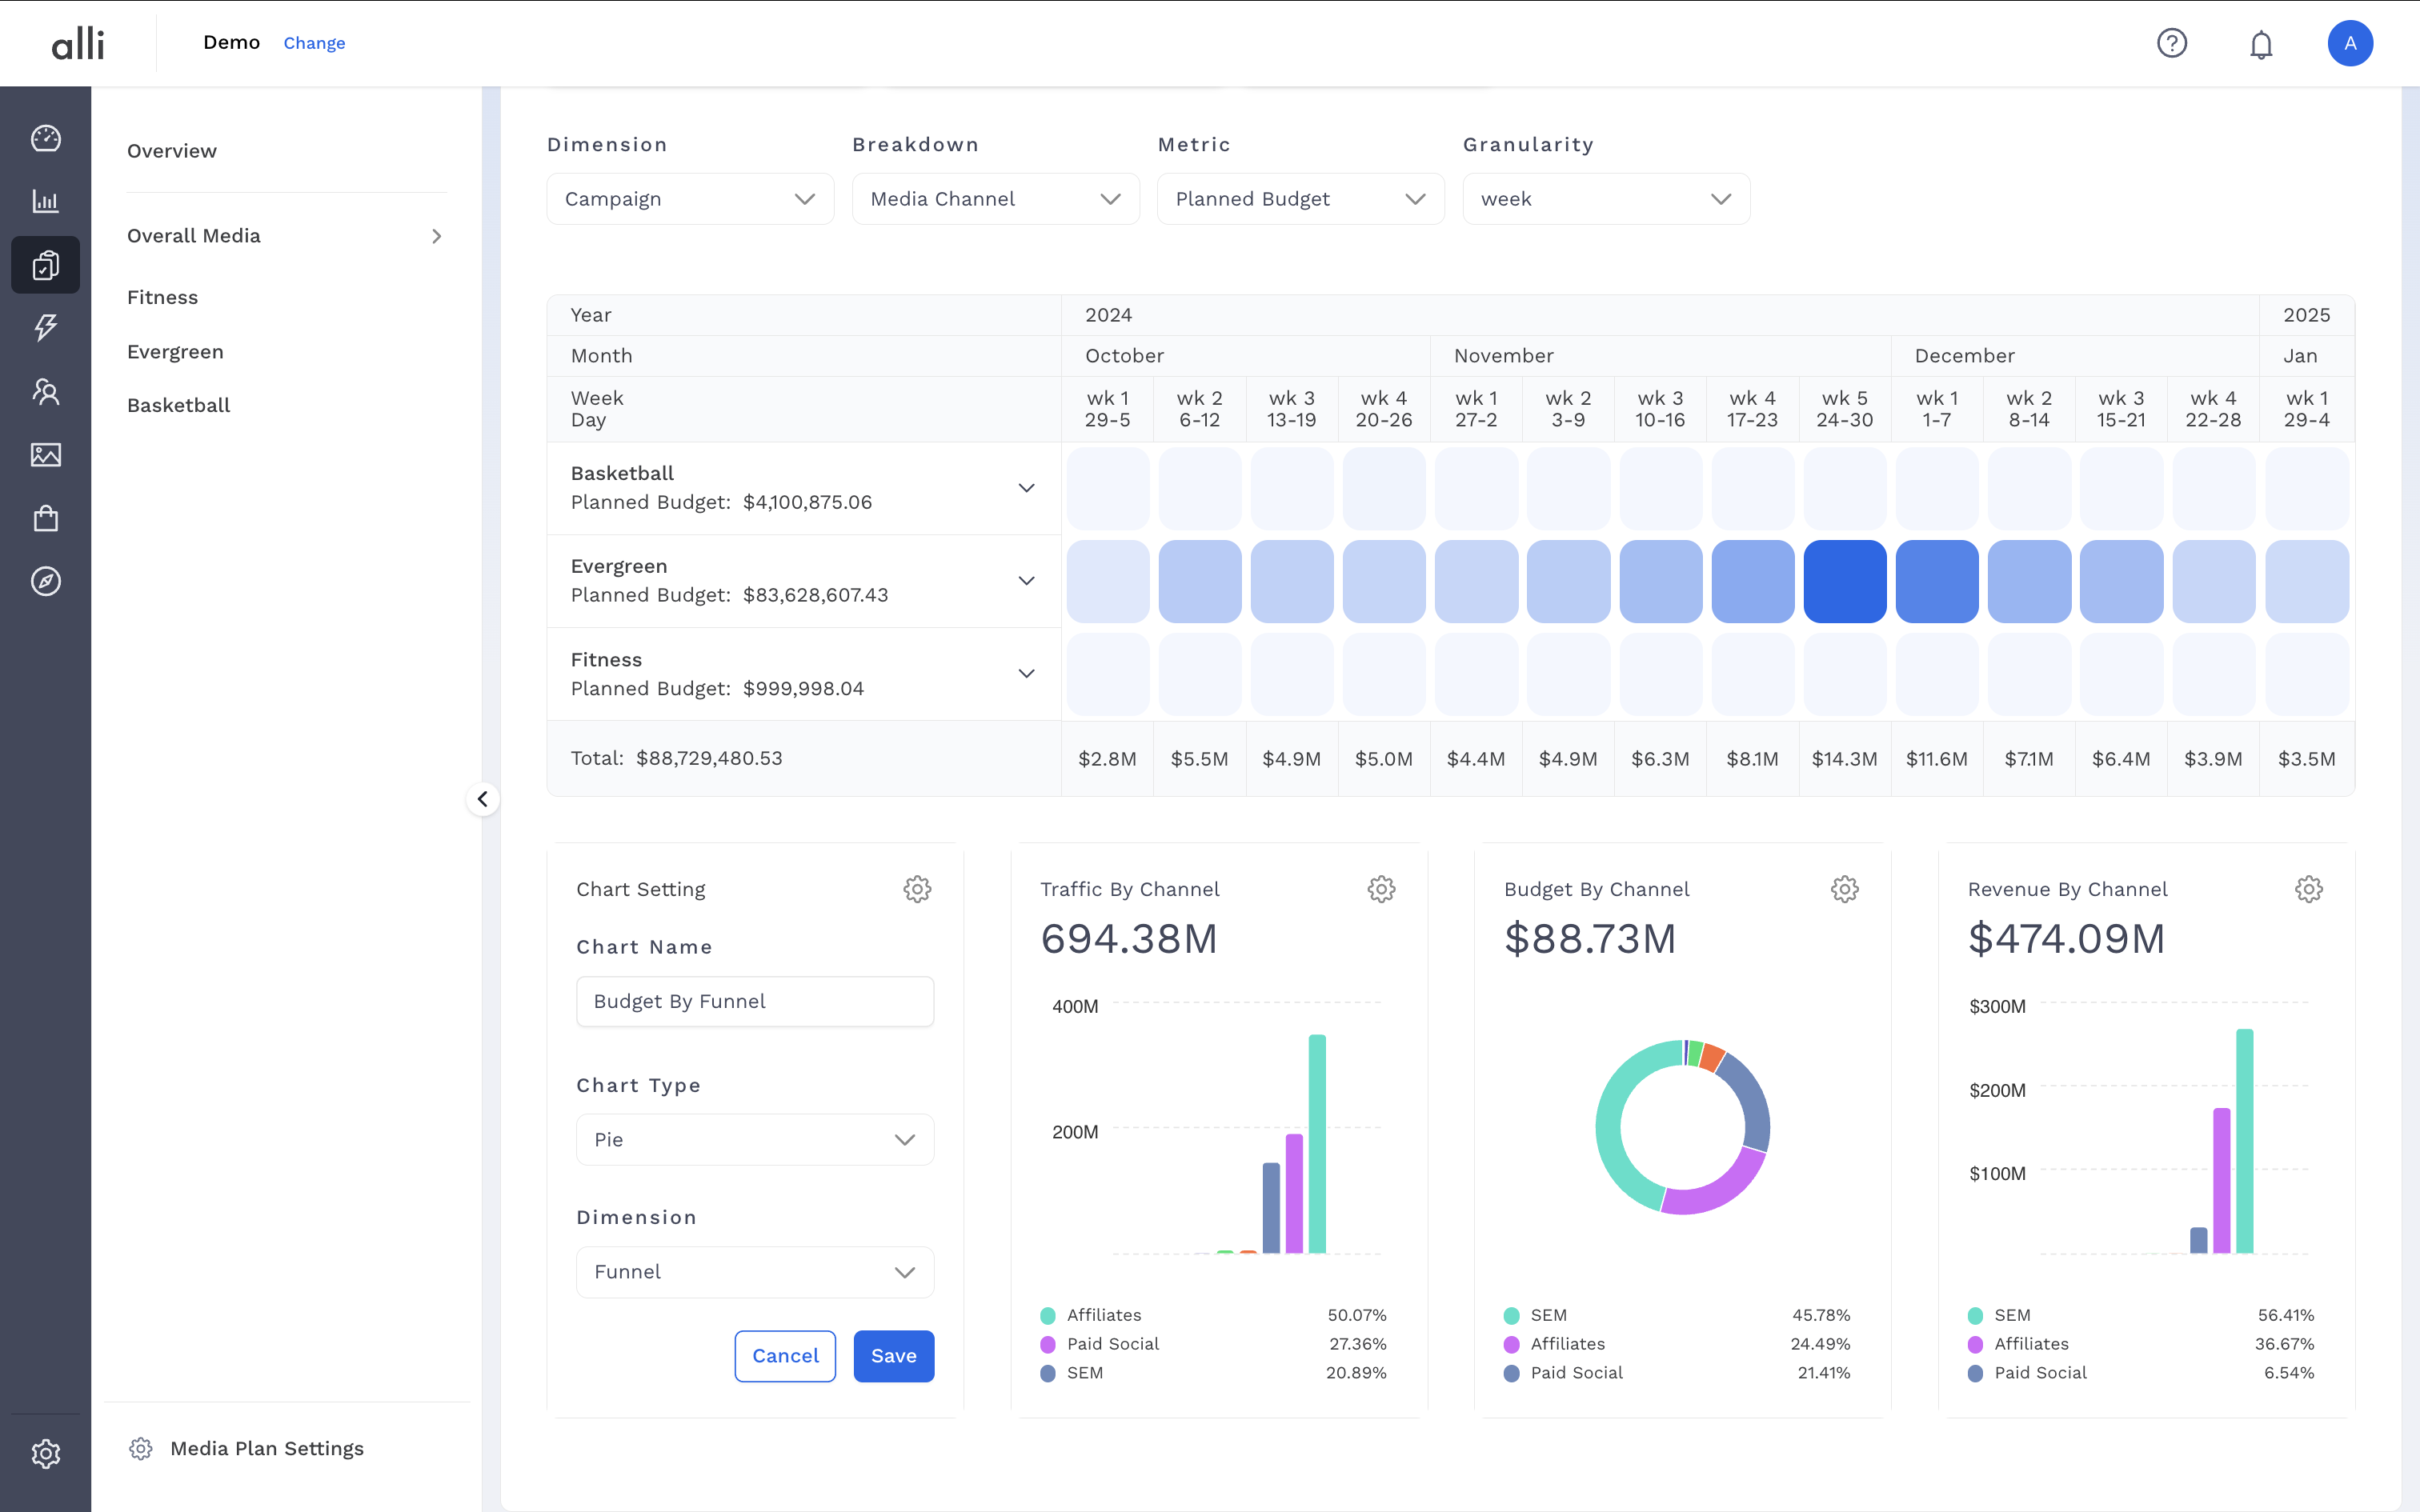
Set up the additional charts by clicking the gear icon, define the inputs, and click Save
-
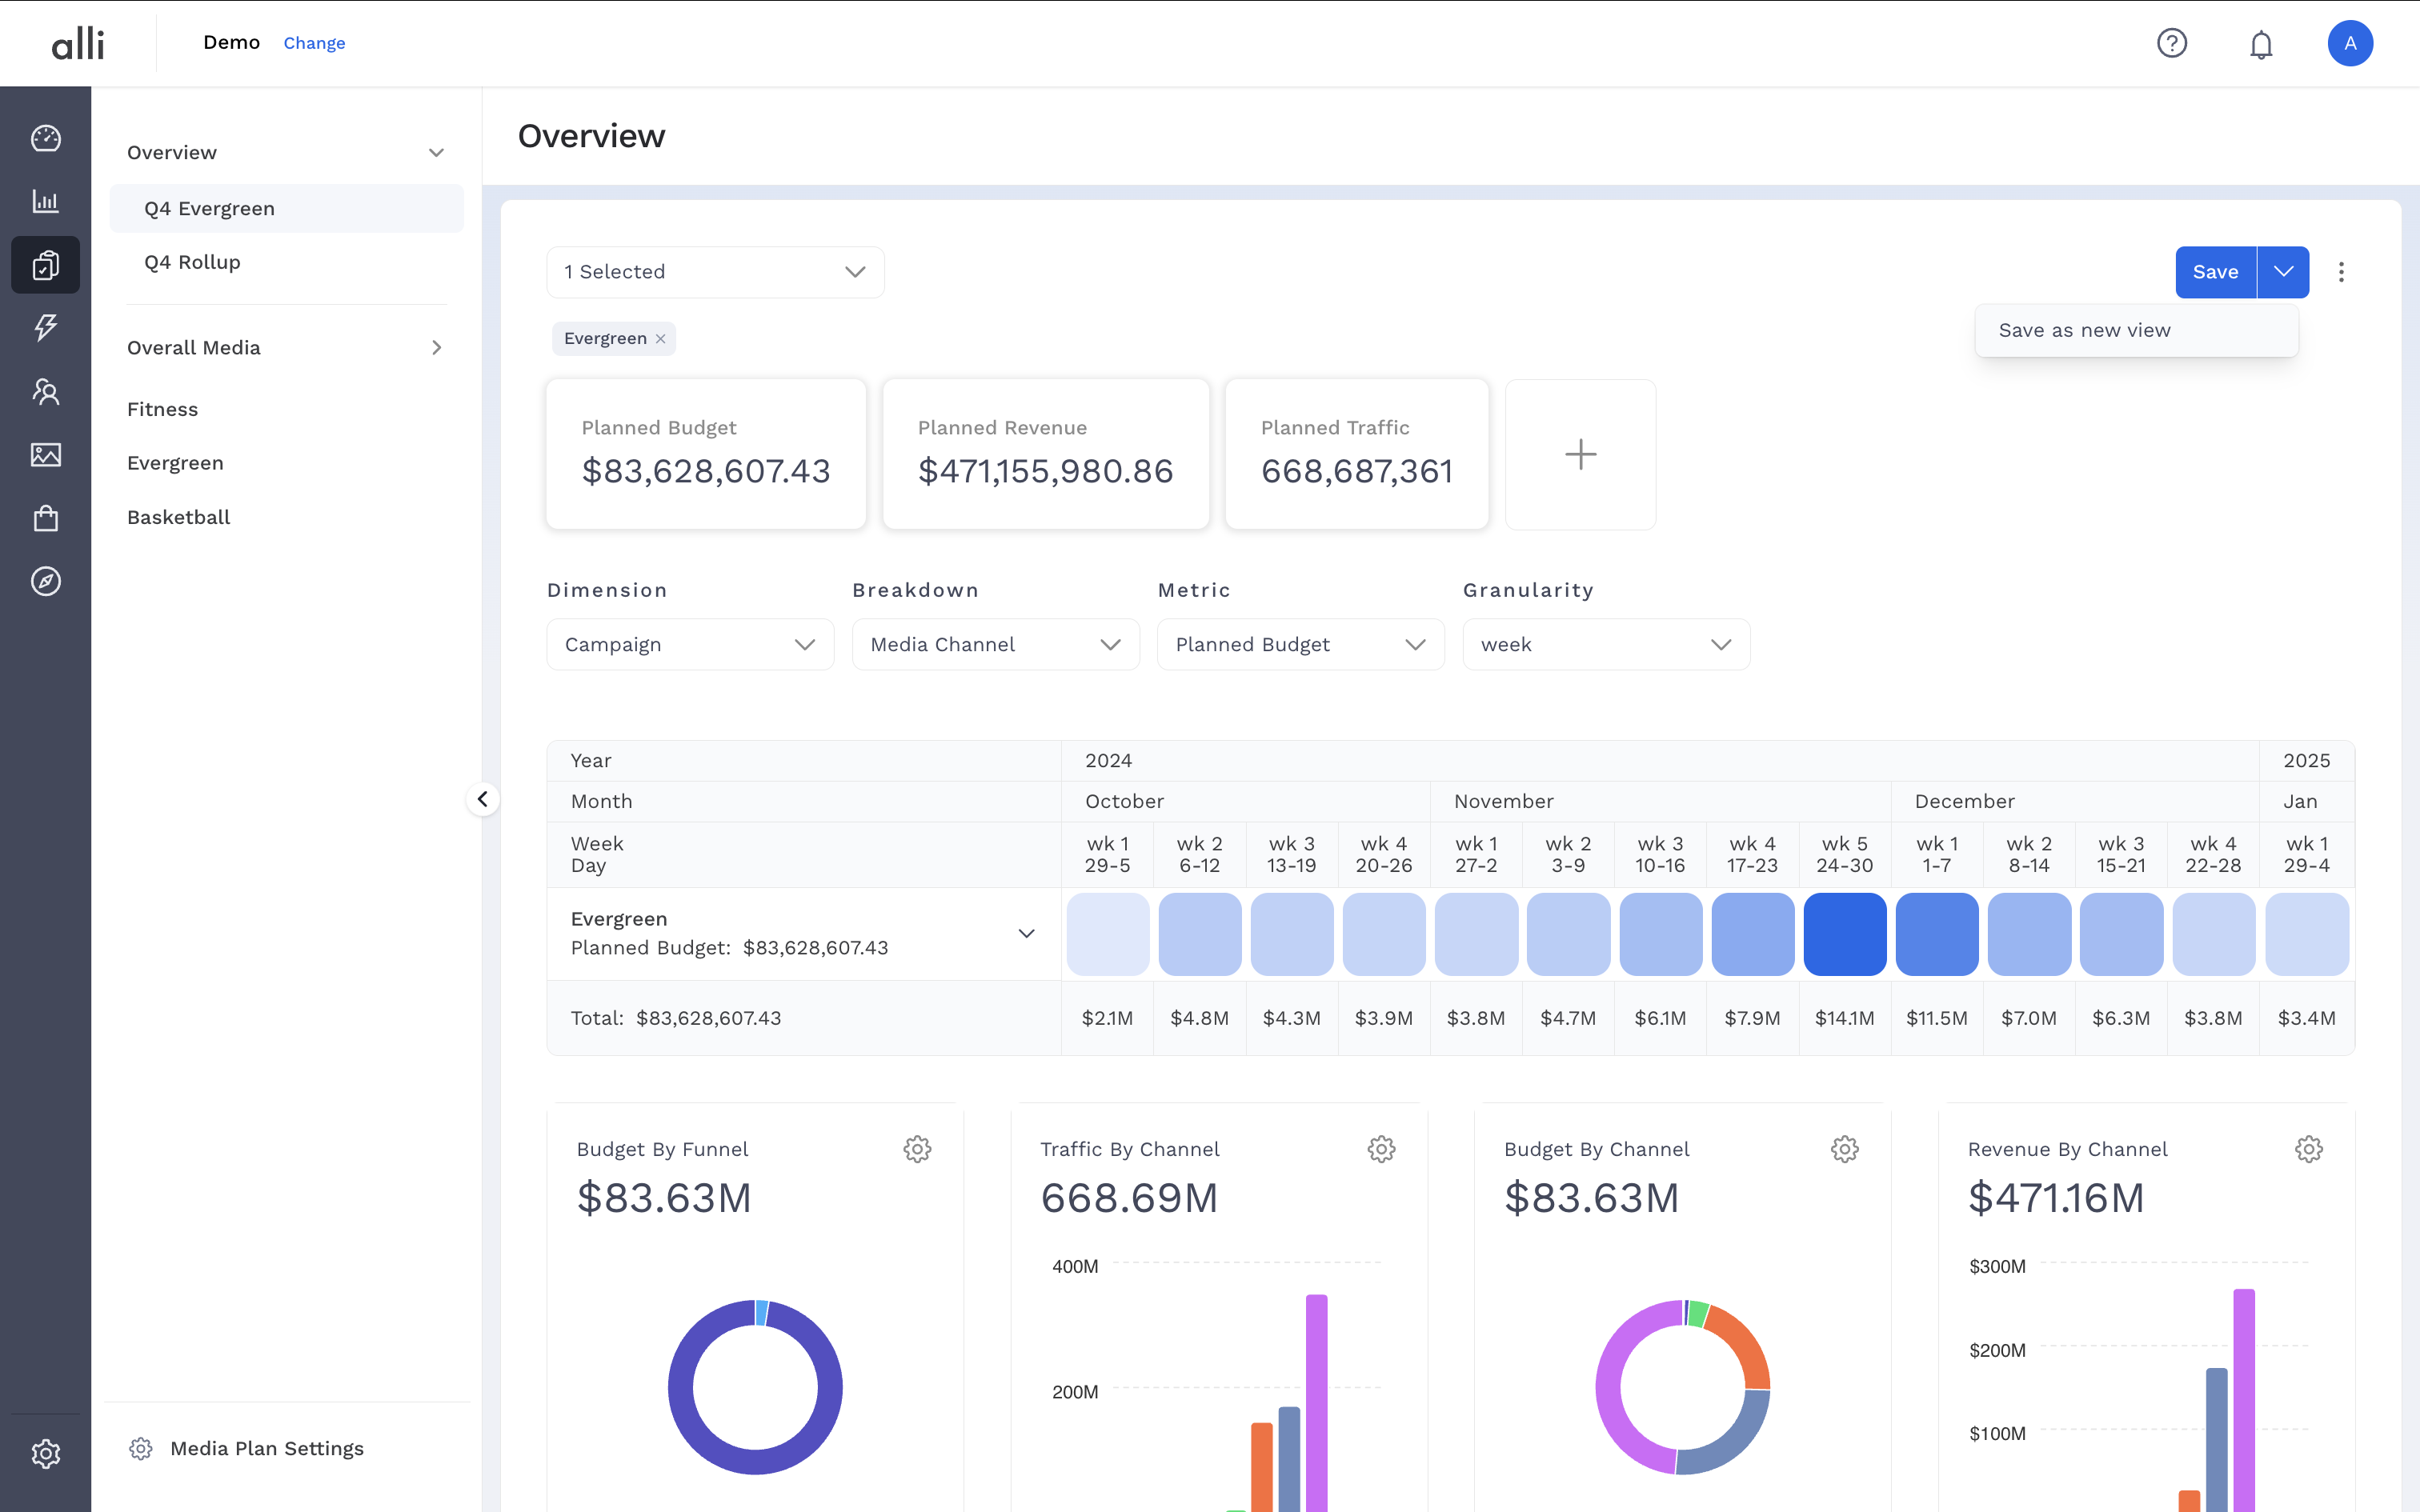
Lastly, to save this view for later and to share via direct link to Alli, click Save in the upper right corner. This will add the view to the side navigation for future reference.
-
If you would like to create other views for reference and sharing, make any updates to the page’s components, and click the arrow next to save and select Save as new view. This adds a new view to the side navigation for future reference.