
Overview
Instructions
-
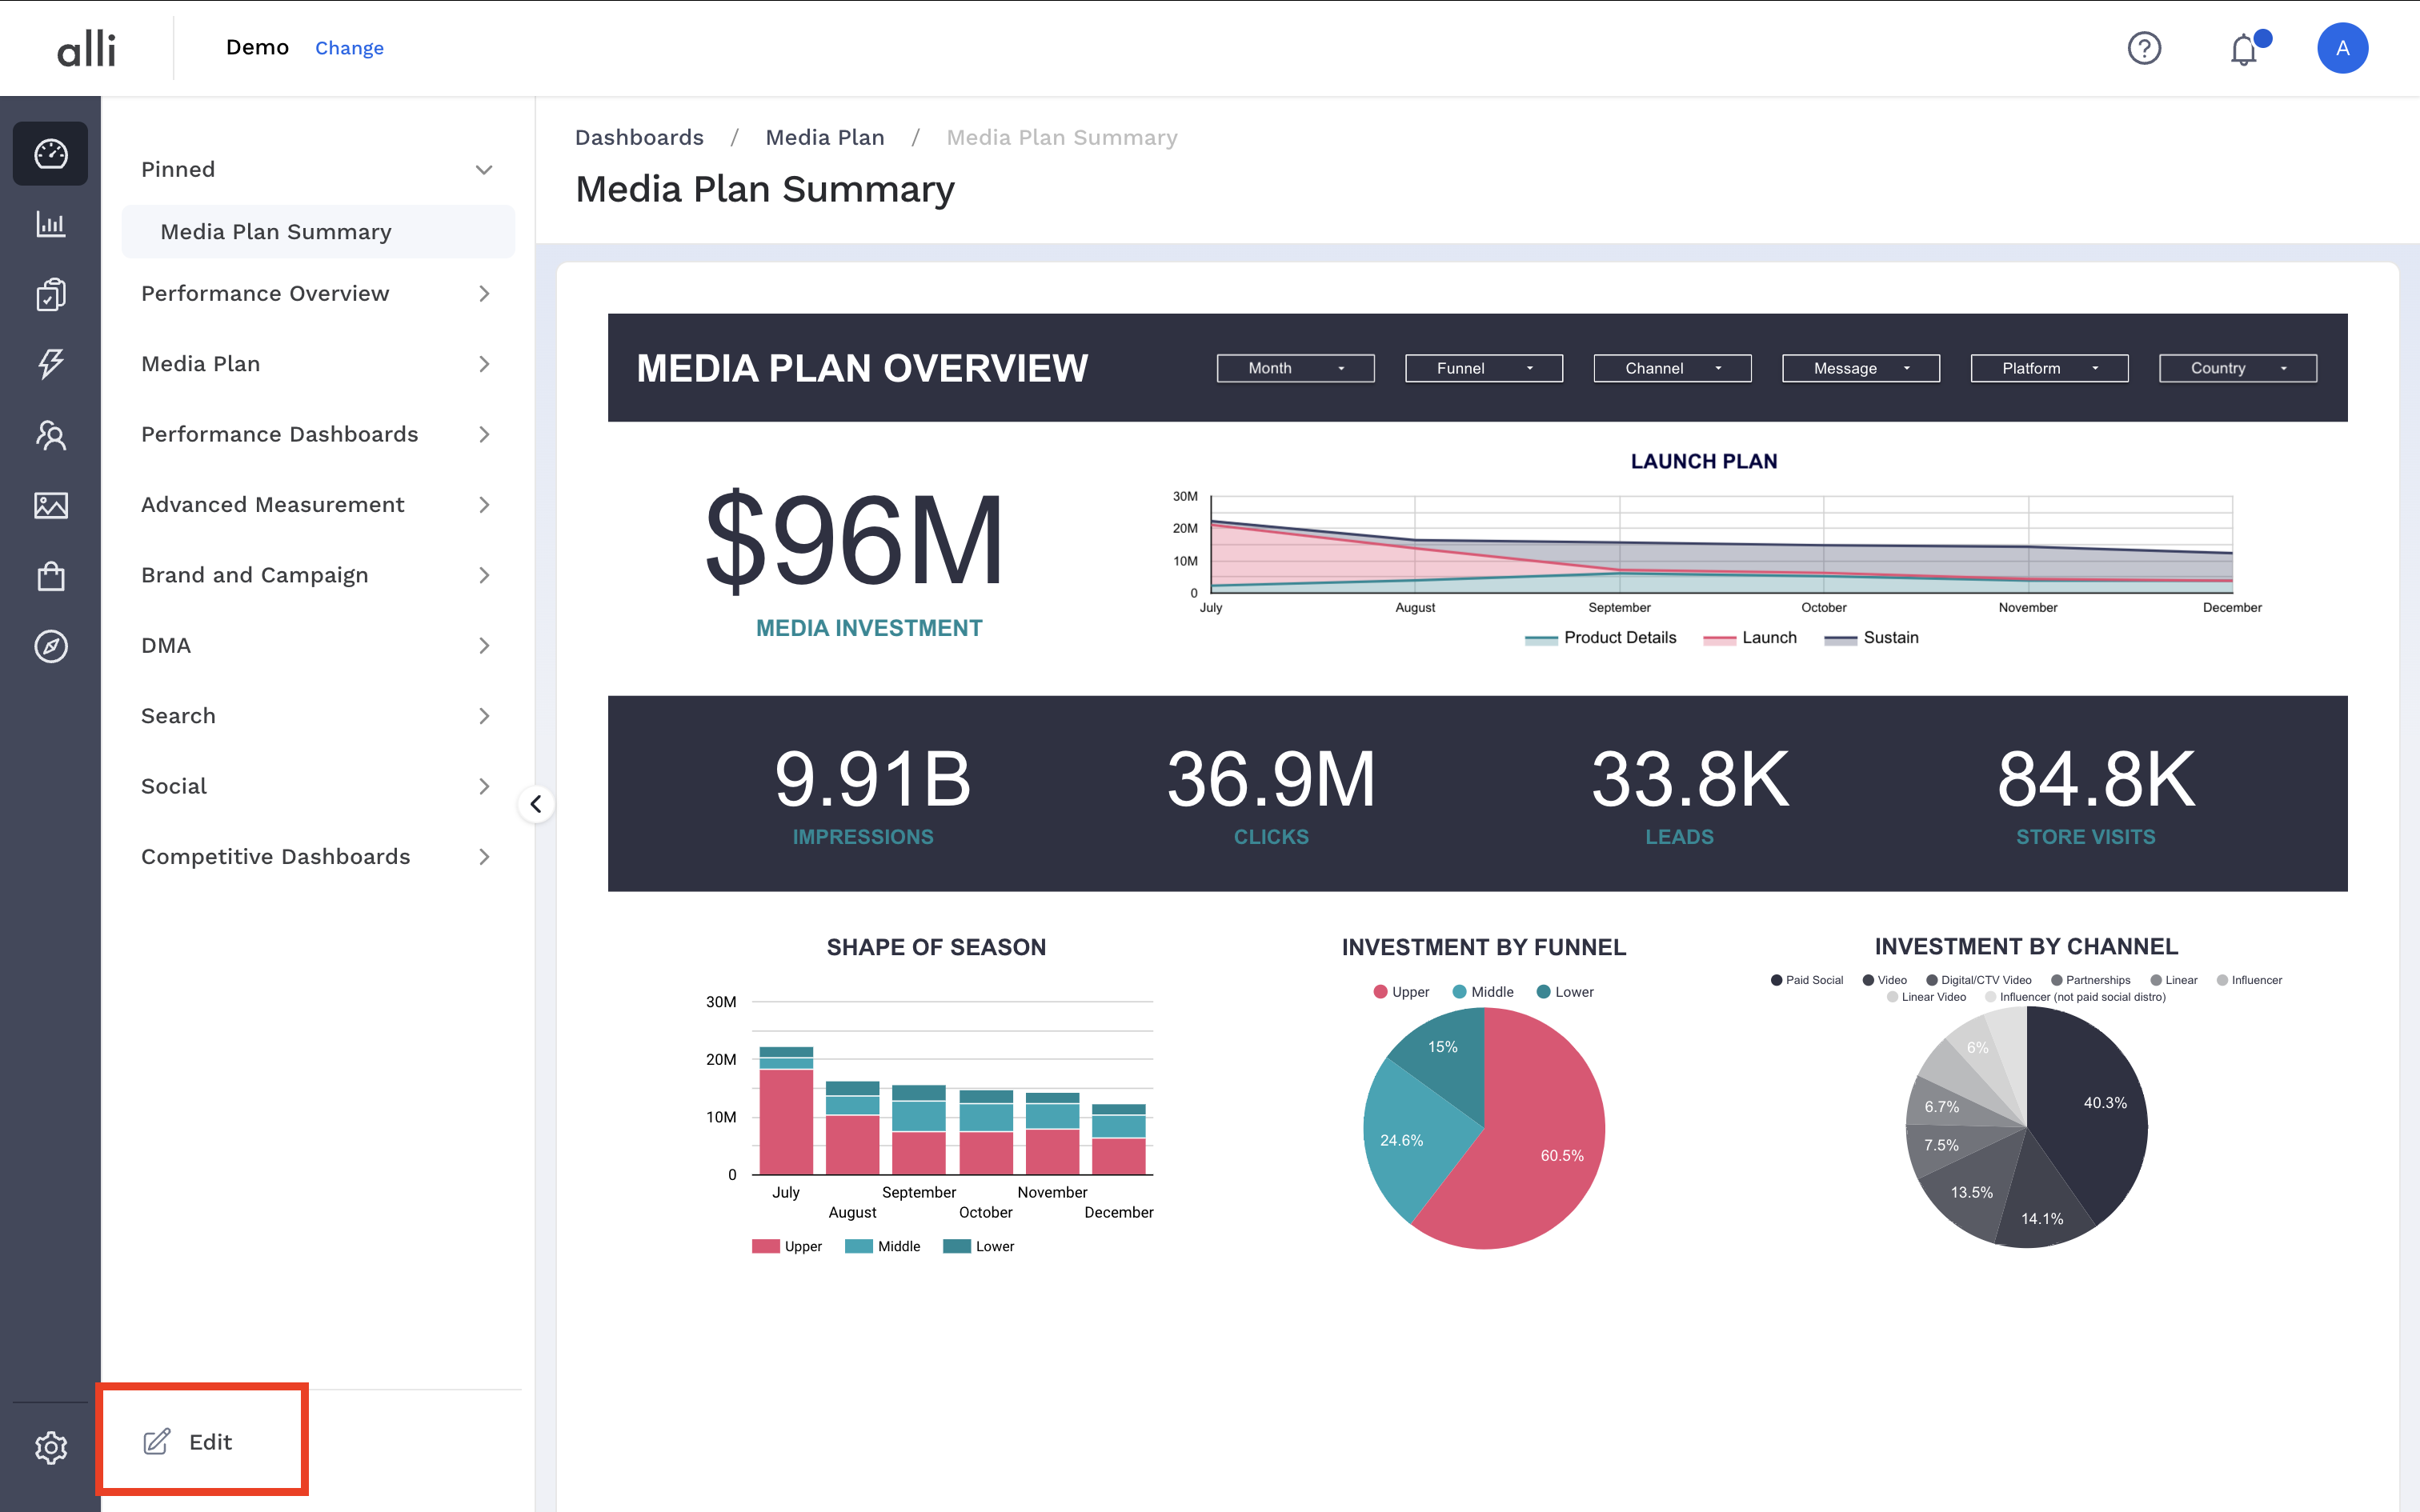
Under Dashboards, click on Edit in the lower left of the screen.
-
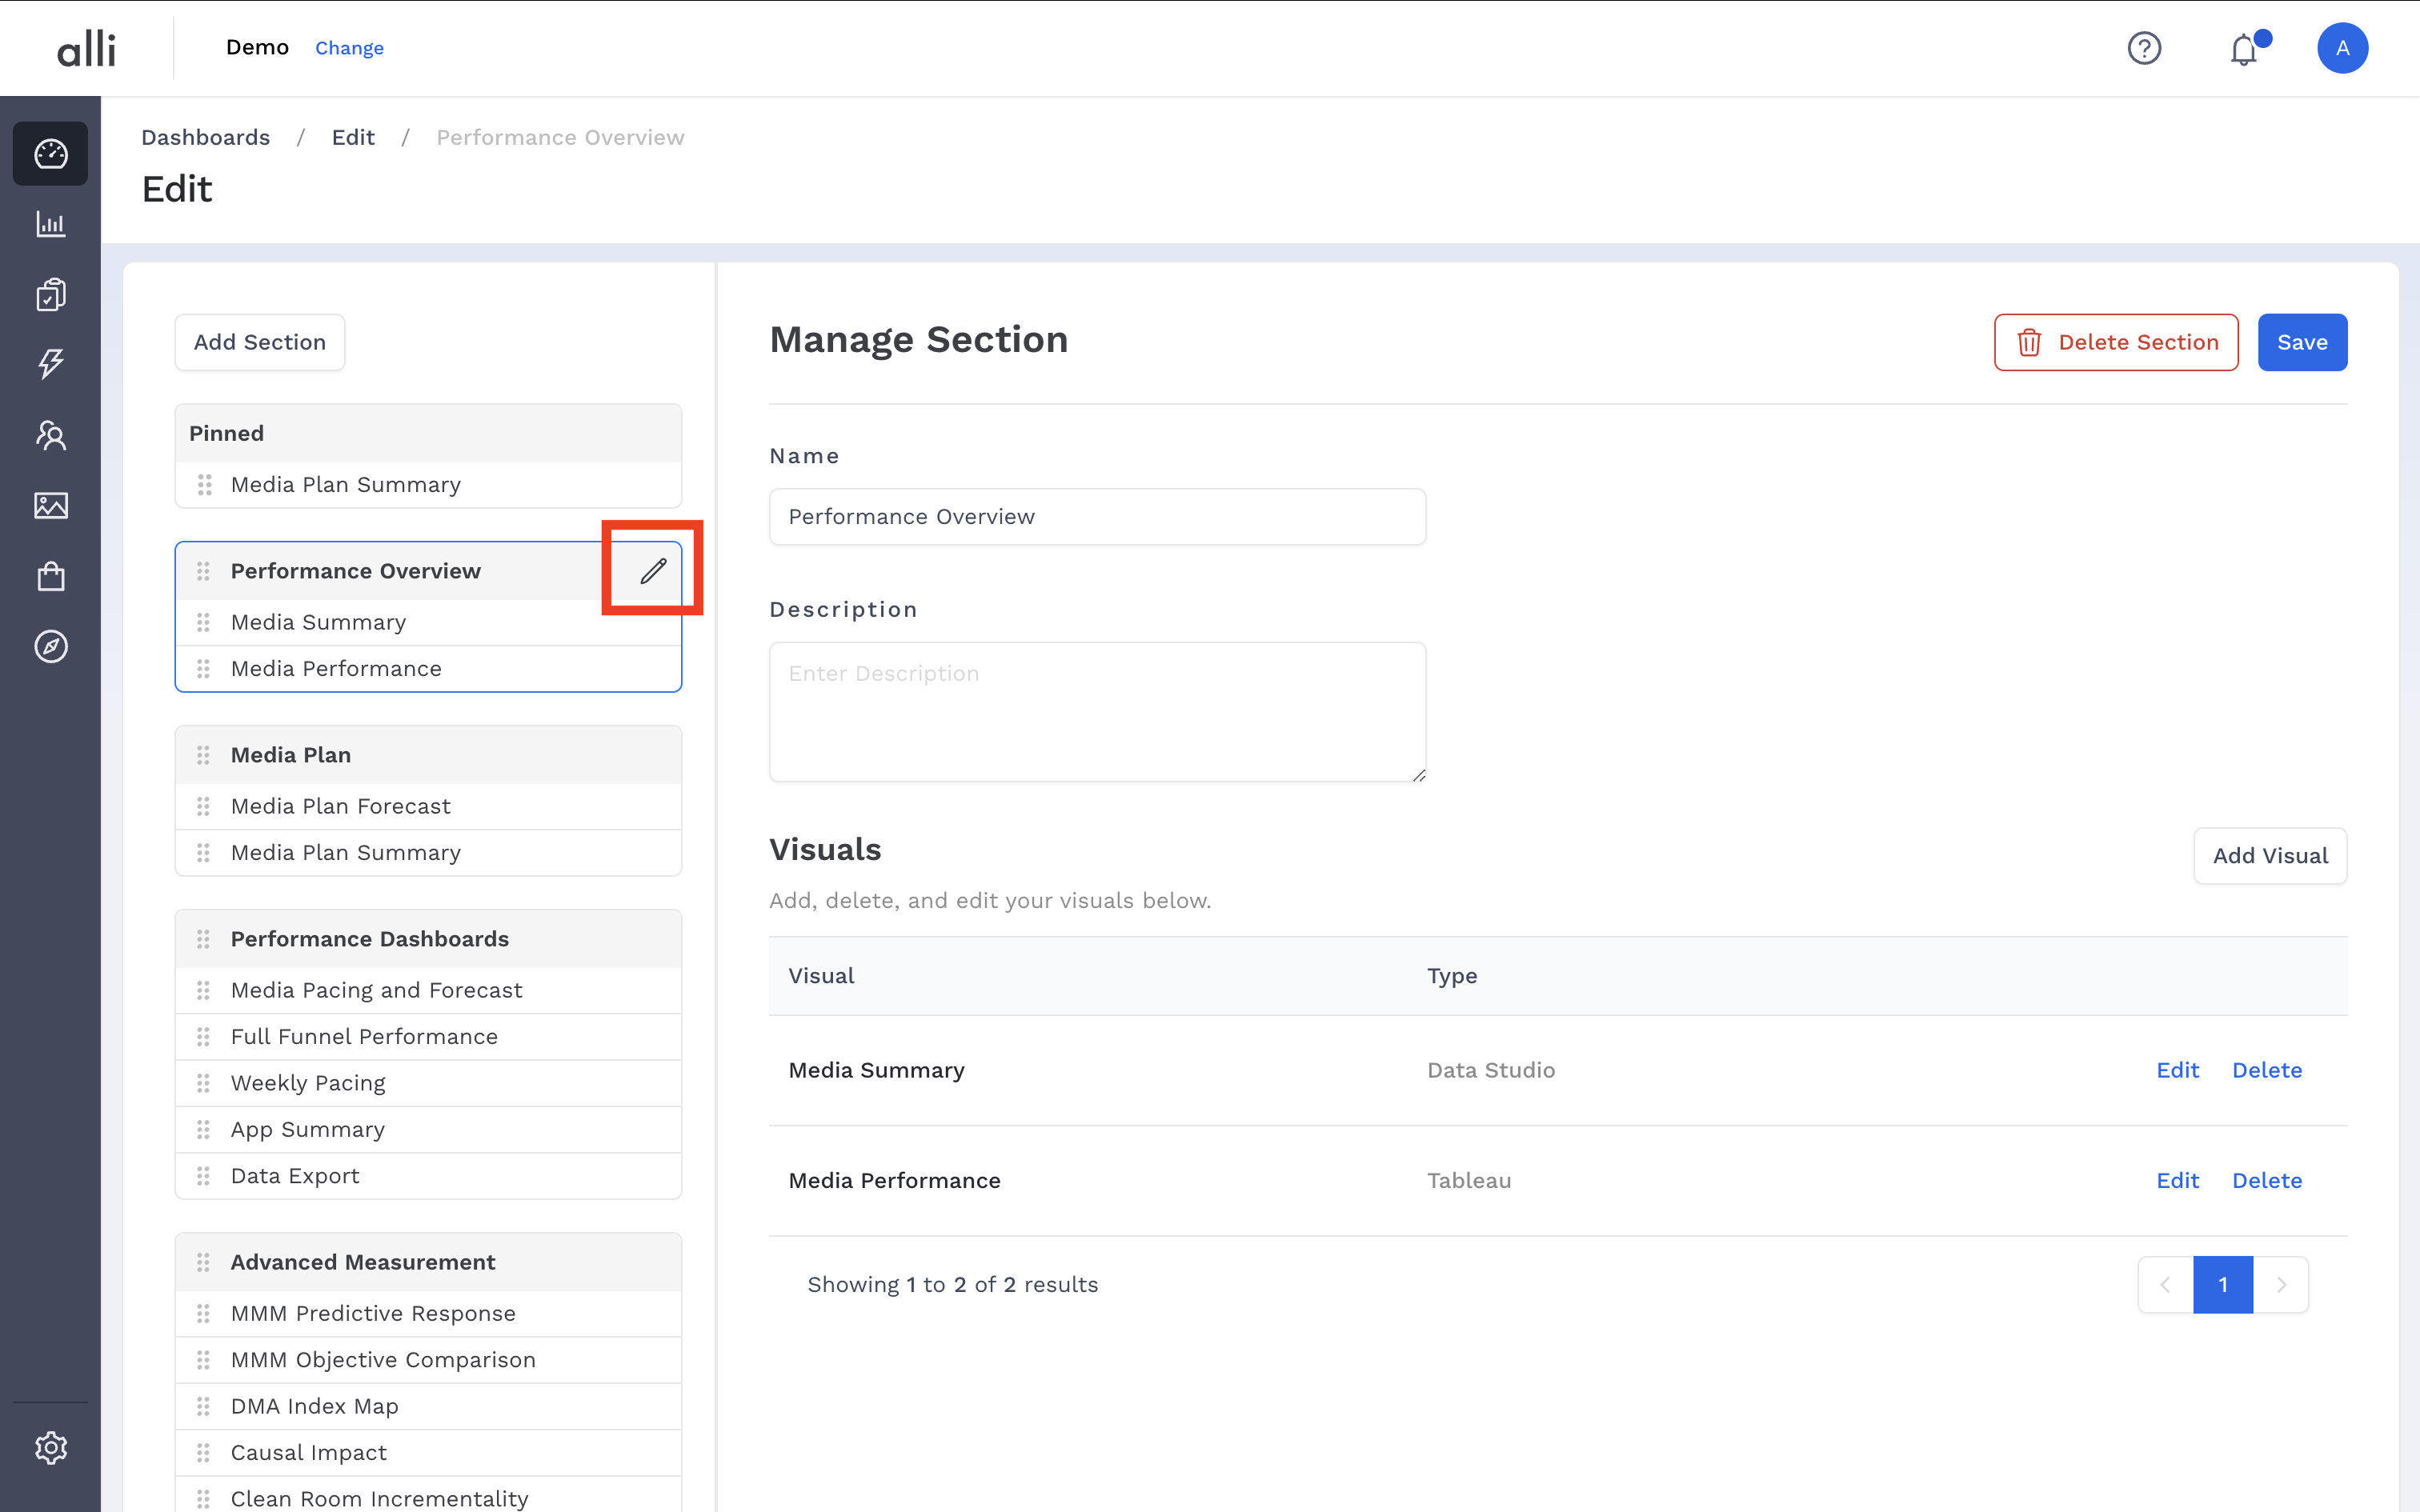
To add a document, click on the Pencil next to the section header of your choice
-
You can customize the Section Heading name as well as the Section Description.
-
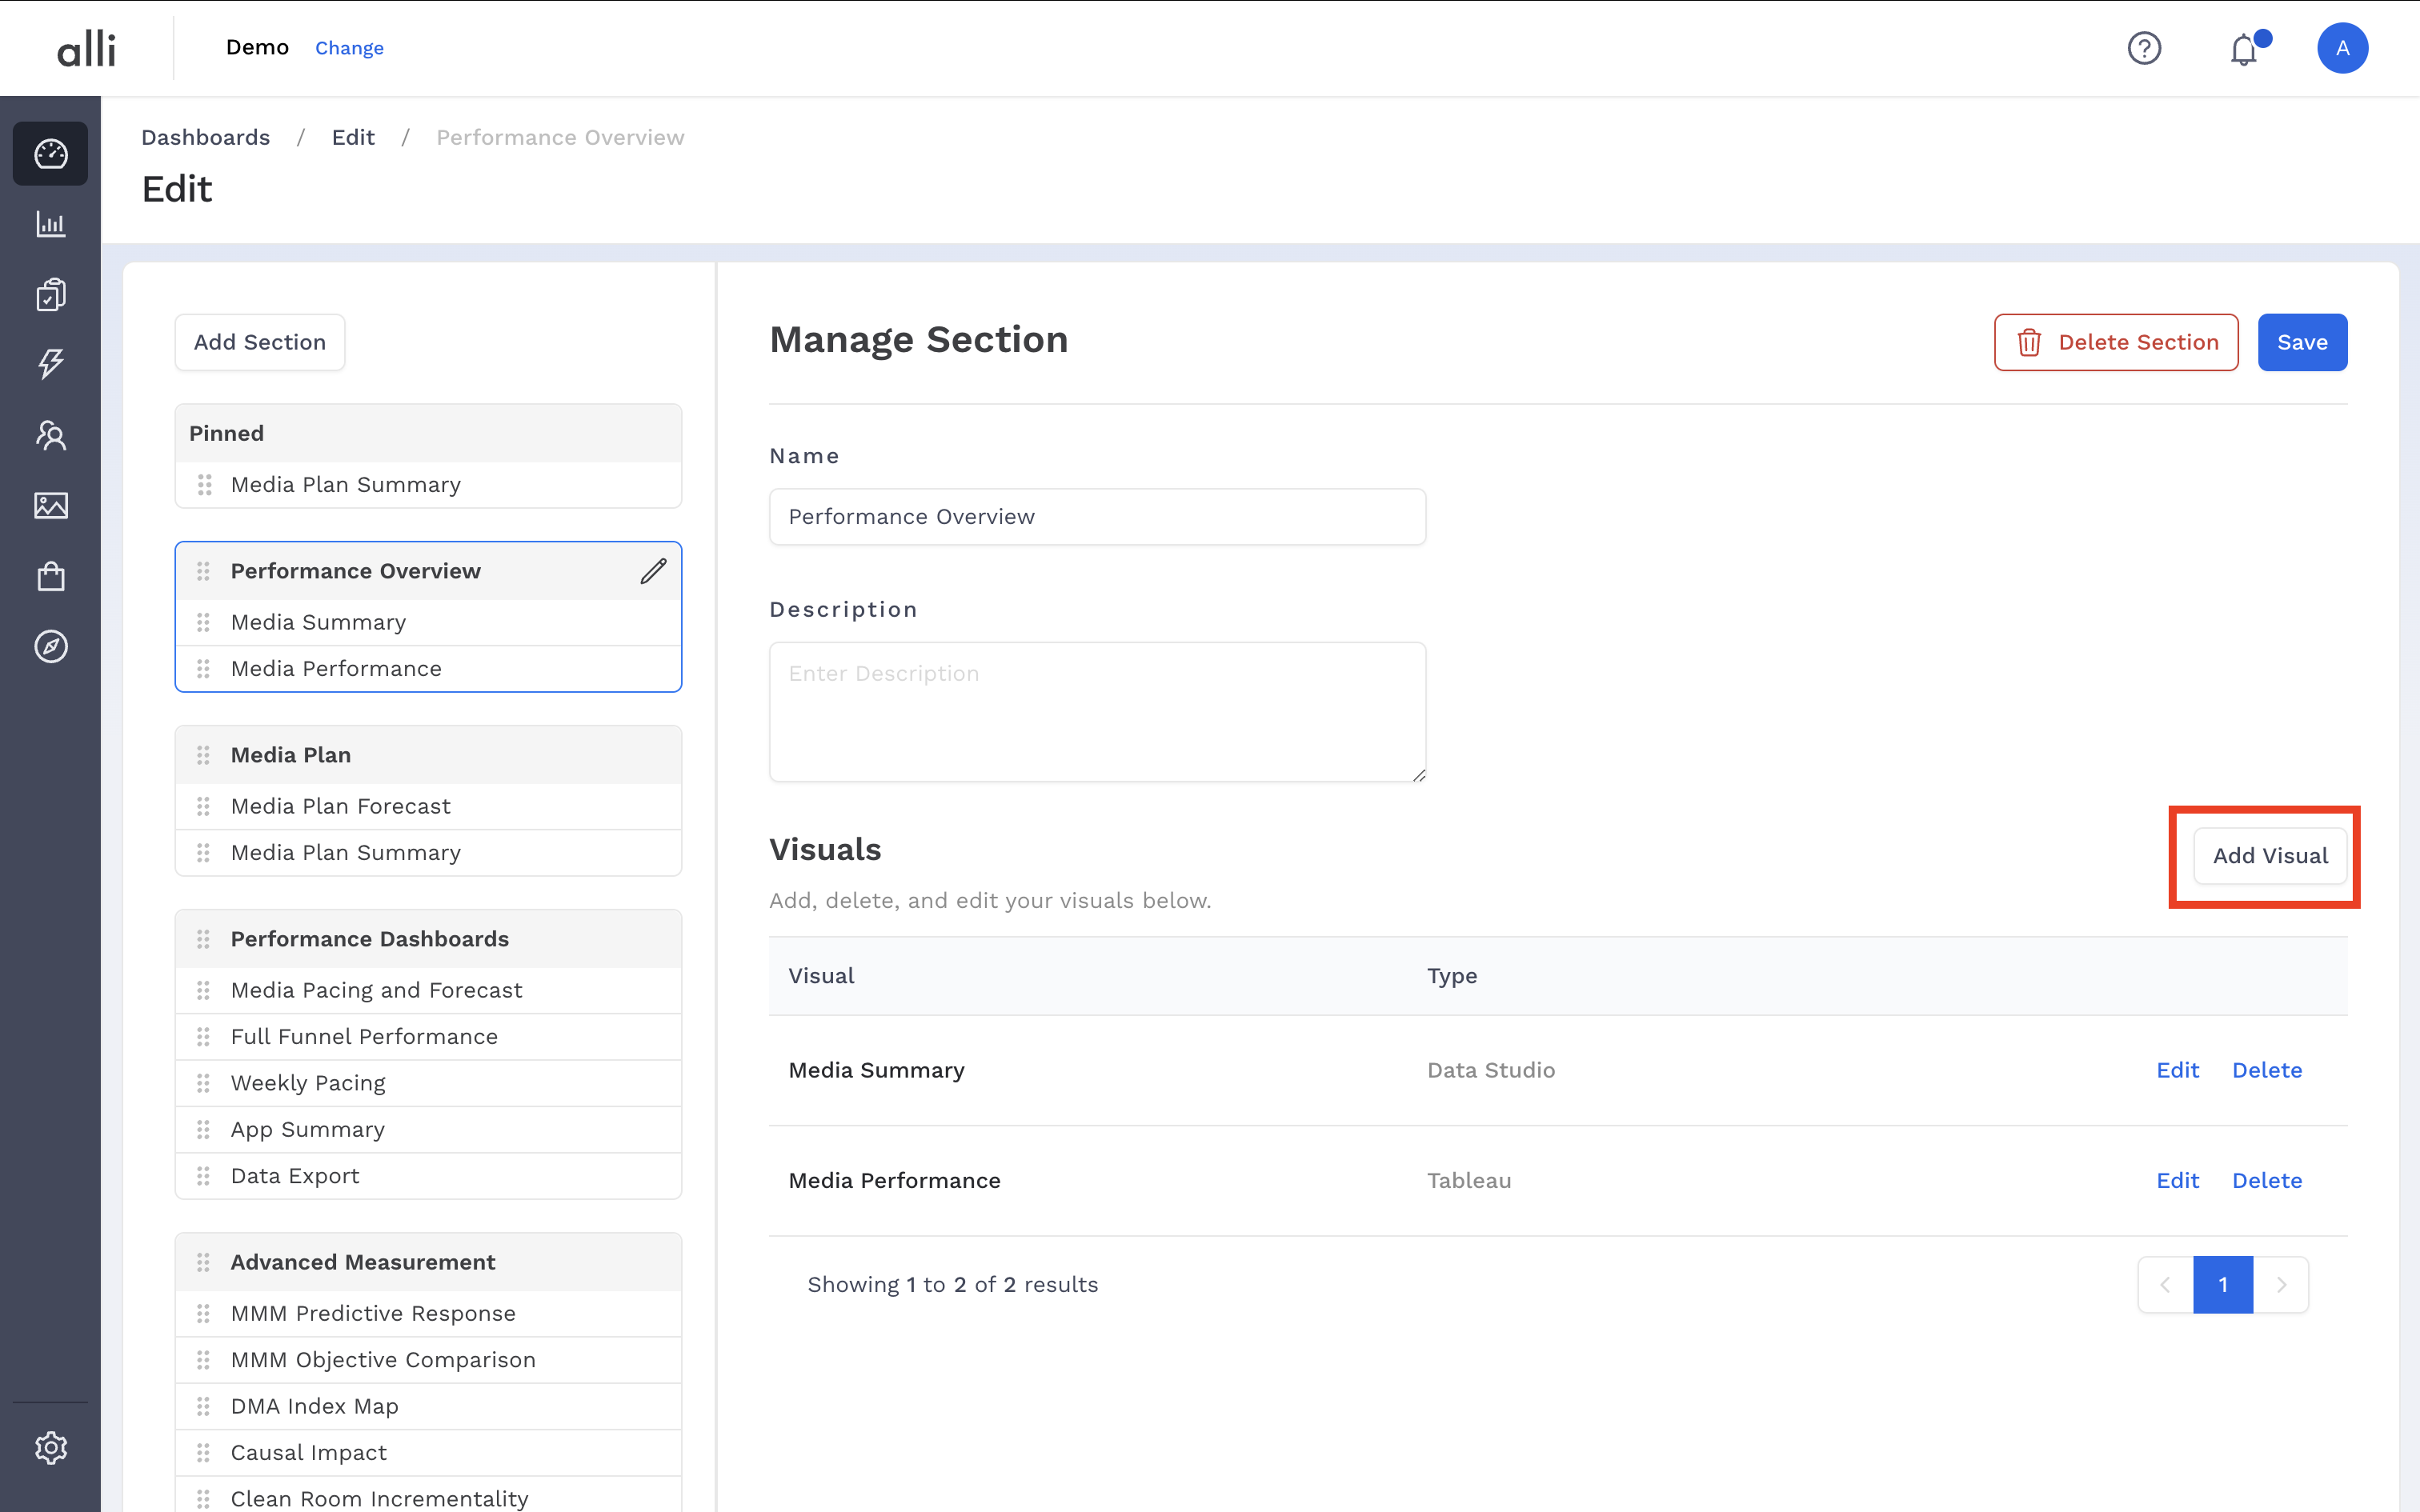
Click the Add Visual button above the existing Visuals section.
-
Update the Name and Description.
-
Update the Type of visualization.
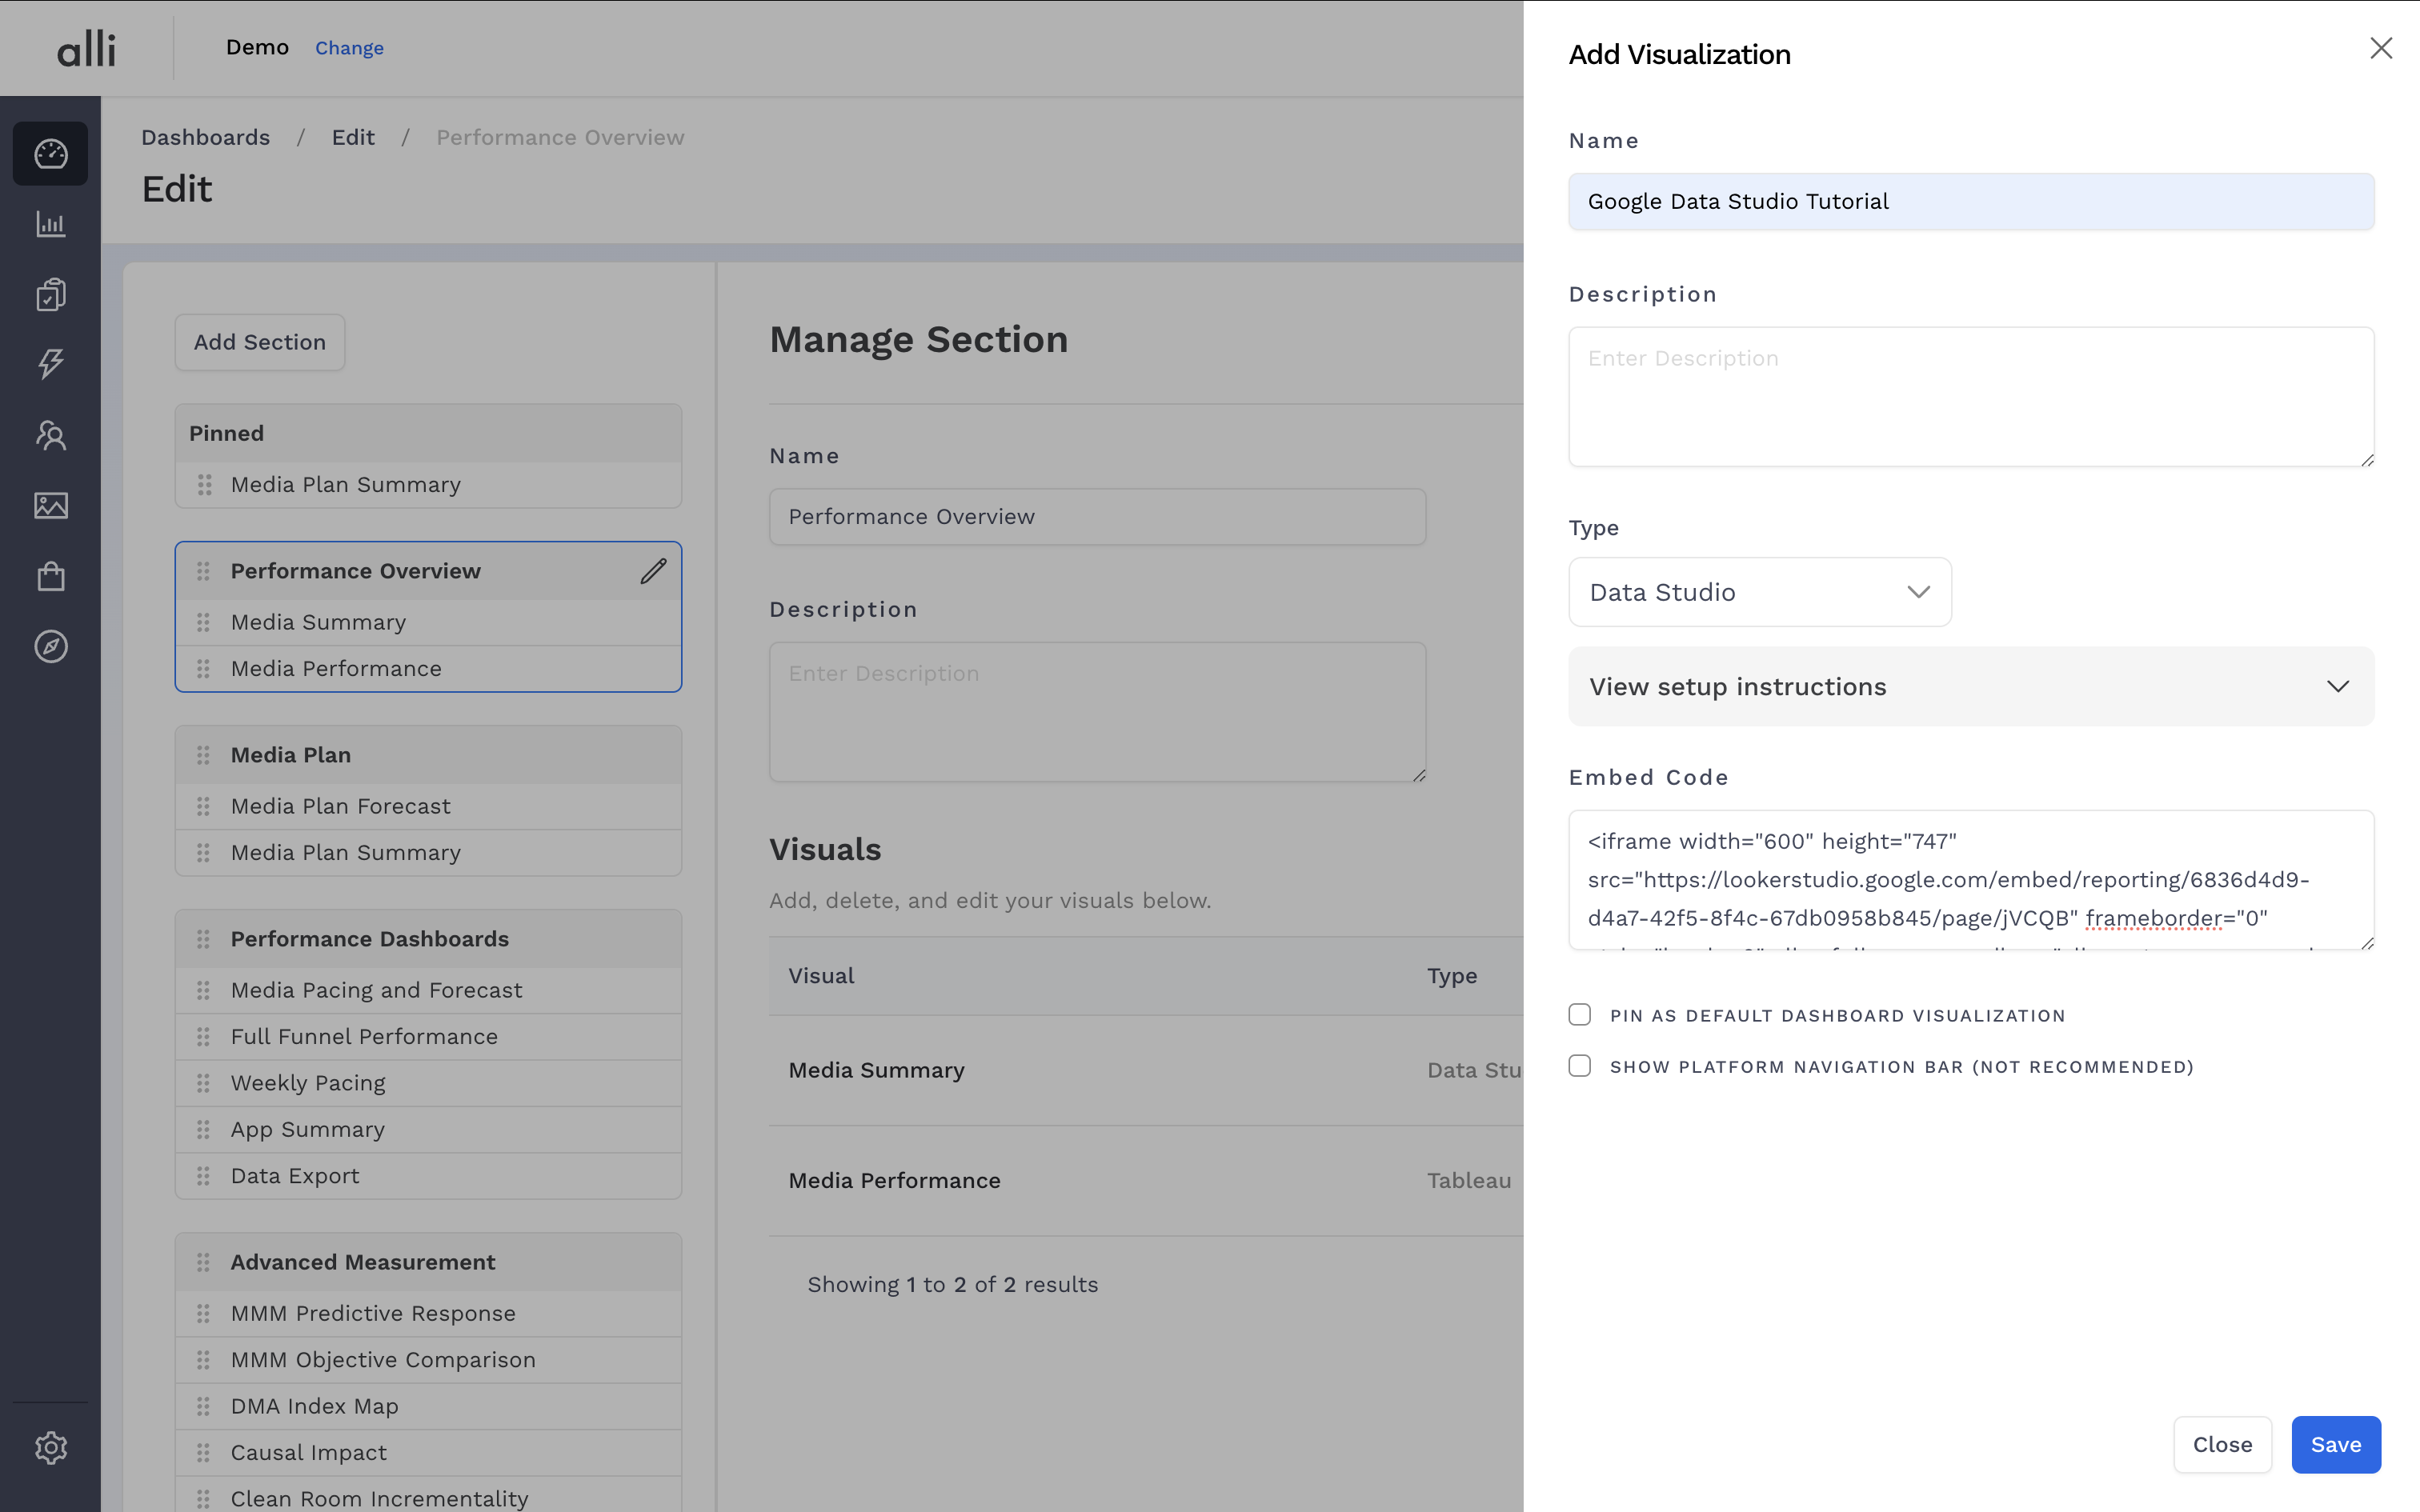
If you do not see the Type that you need, click Google Sheets/Docs and add the Embed Code to the box underneath the dropdown. Any applications that have an embed code (such as PowerBI) can be pasted here.