
Overview
Leveraging advanced filters in Data Explorer’s Report Builder allows you slice your data to fit your data visualization needs.
Instructions
-
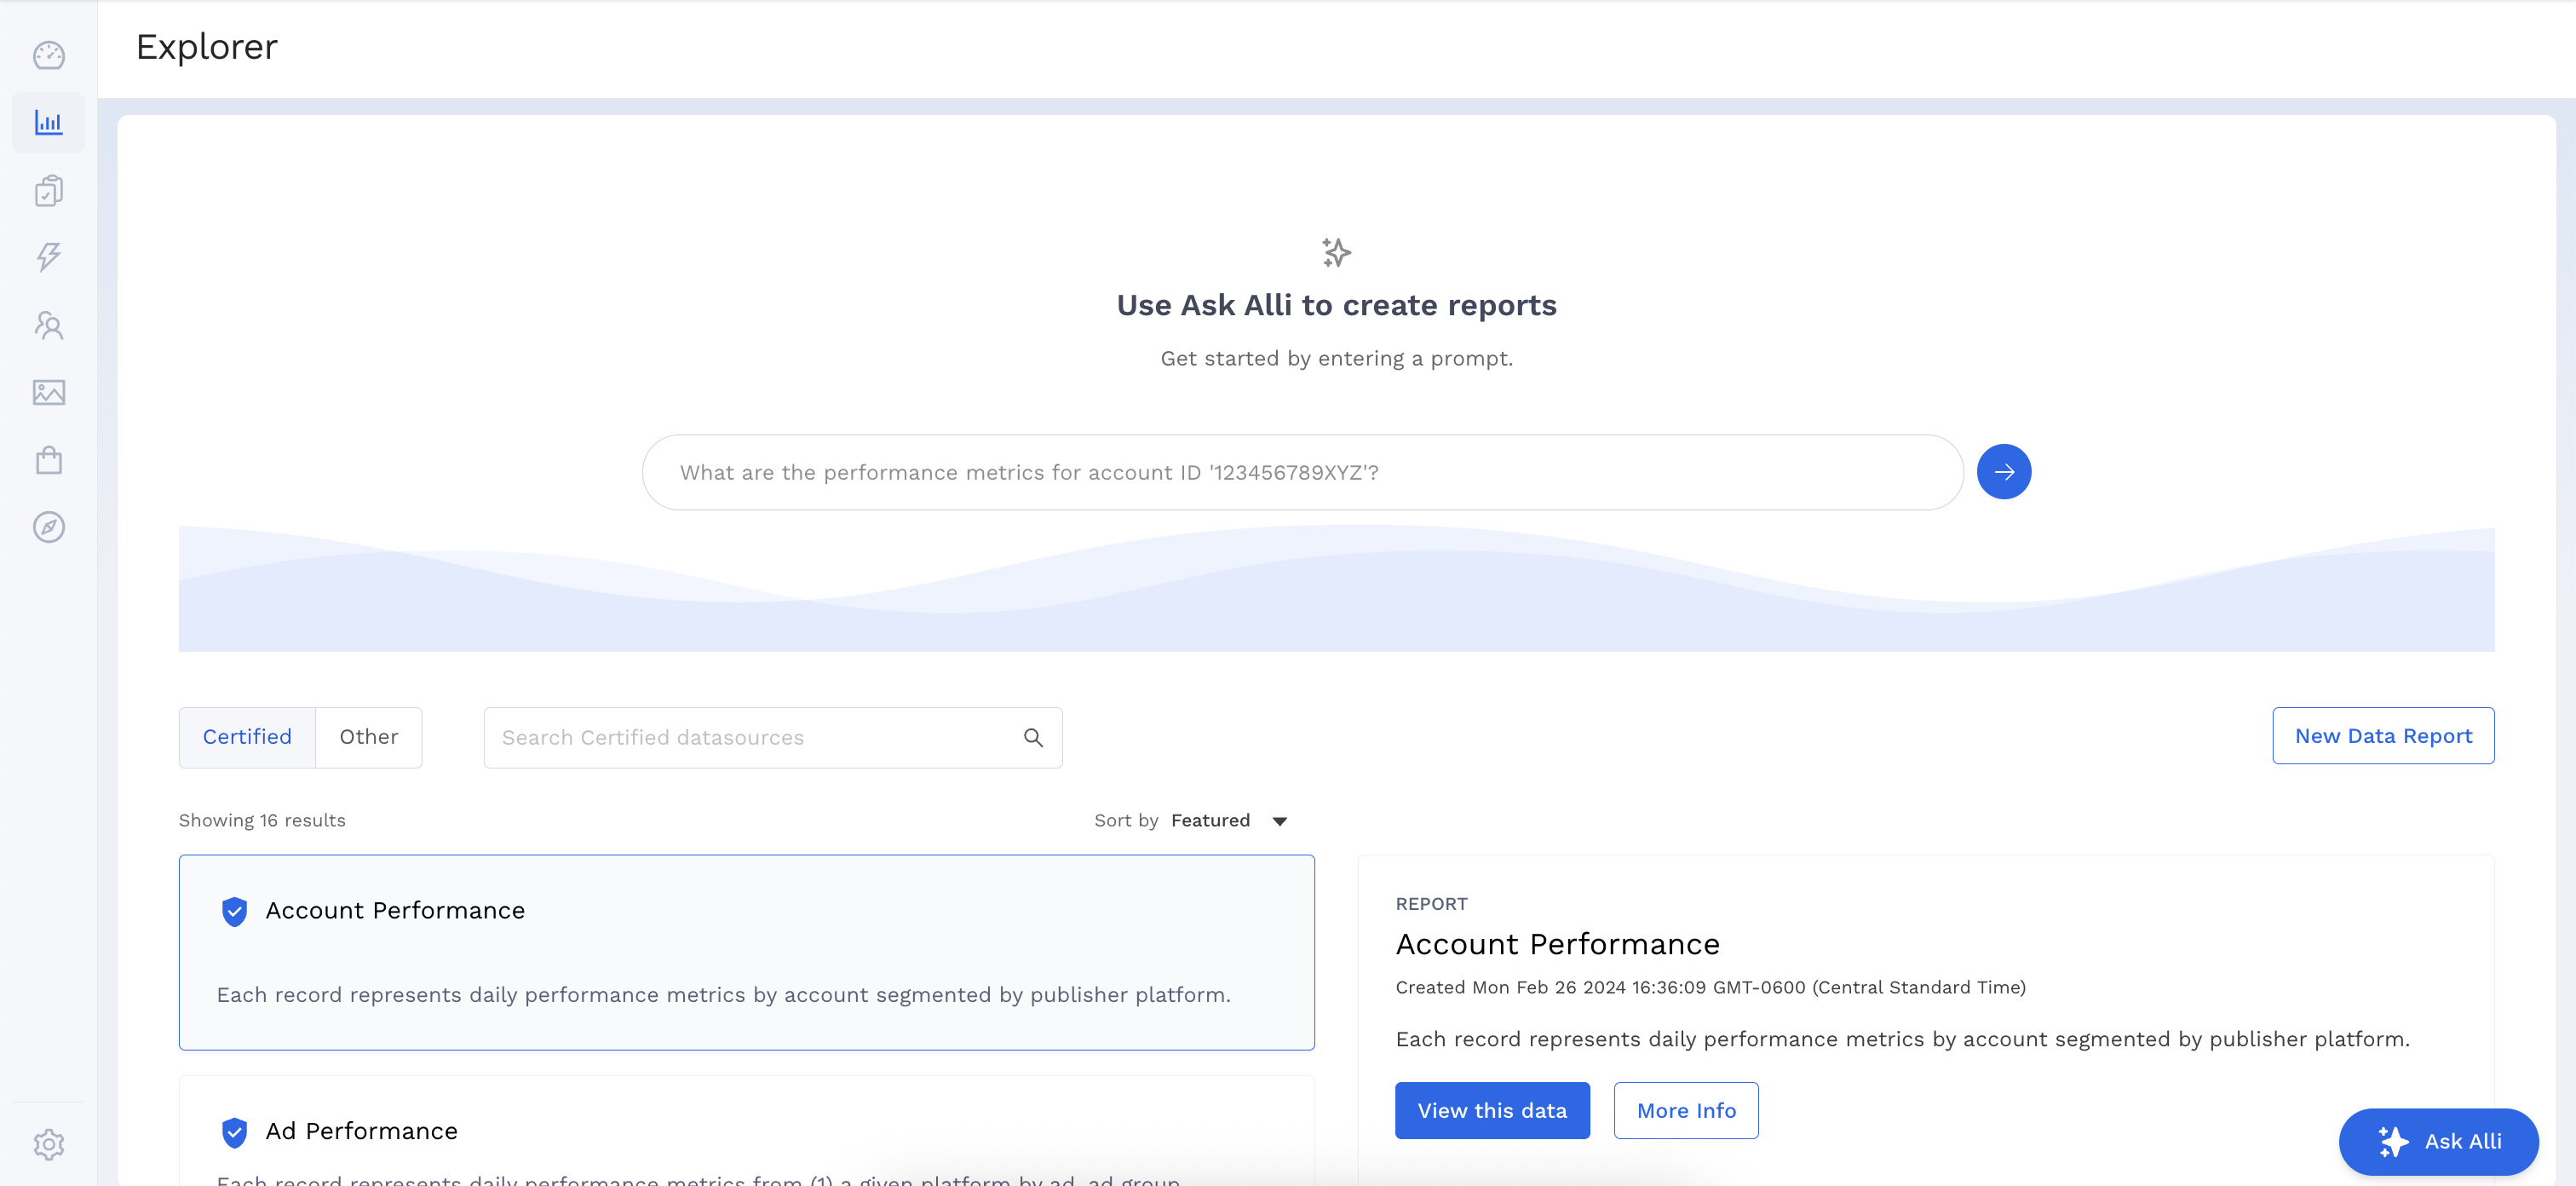
Select a datasource to work with by clicking the View this data button.
-
Add the Dimensions and Metrics you want to appear in your report.
Metrics and Dimensions not in your report can still be used in your filters.
-
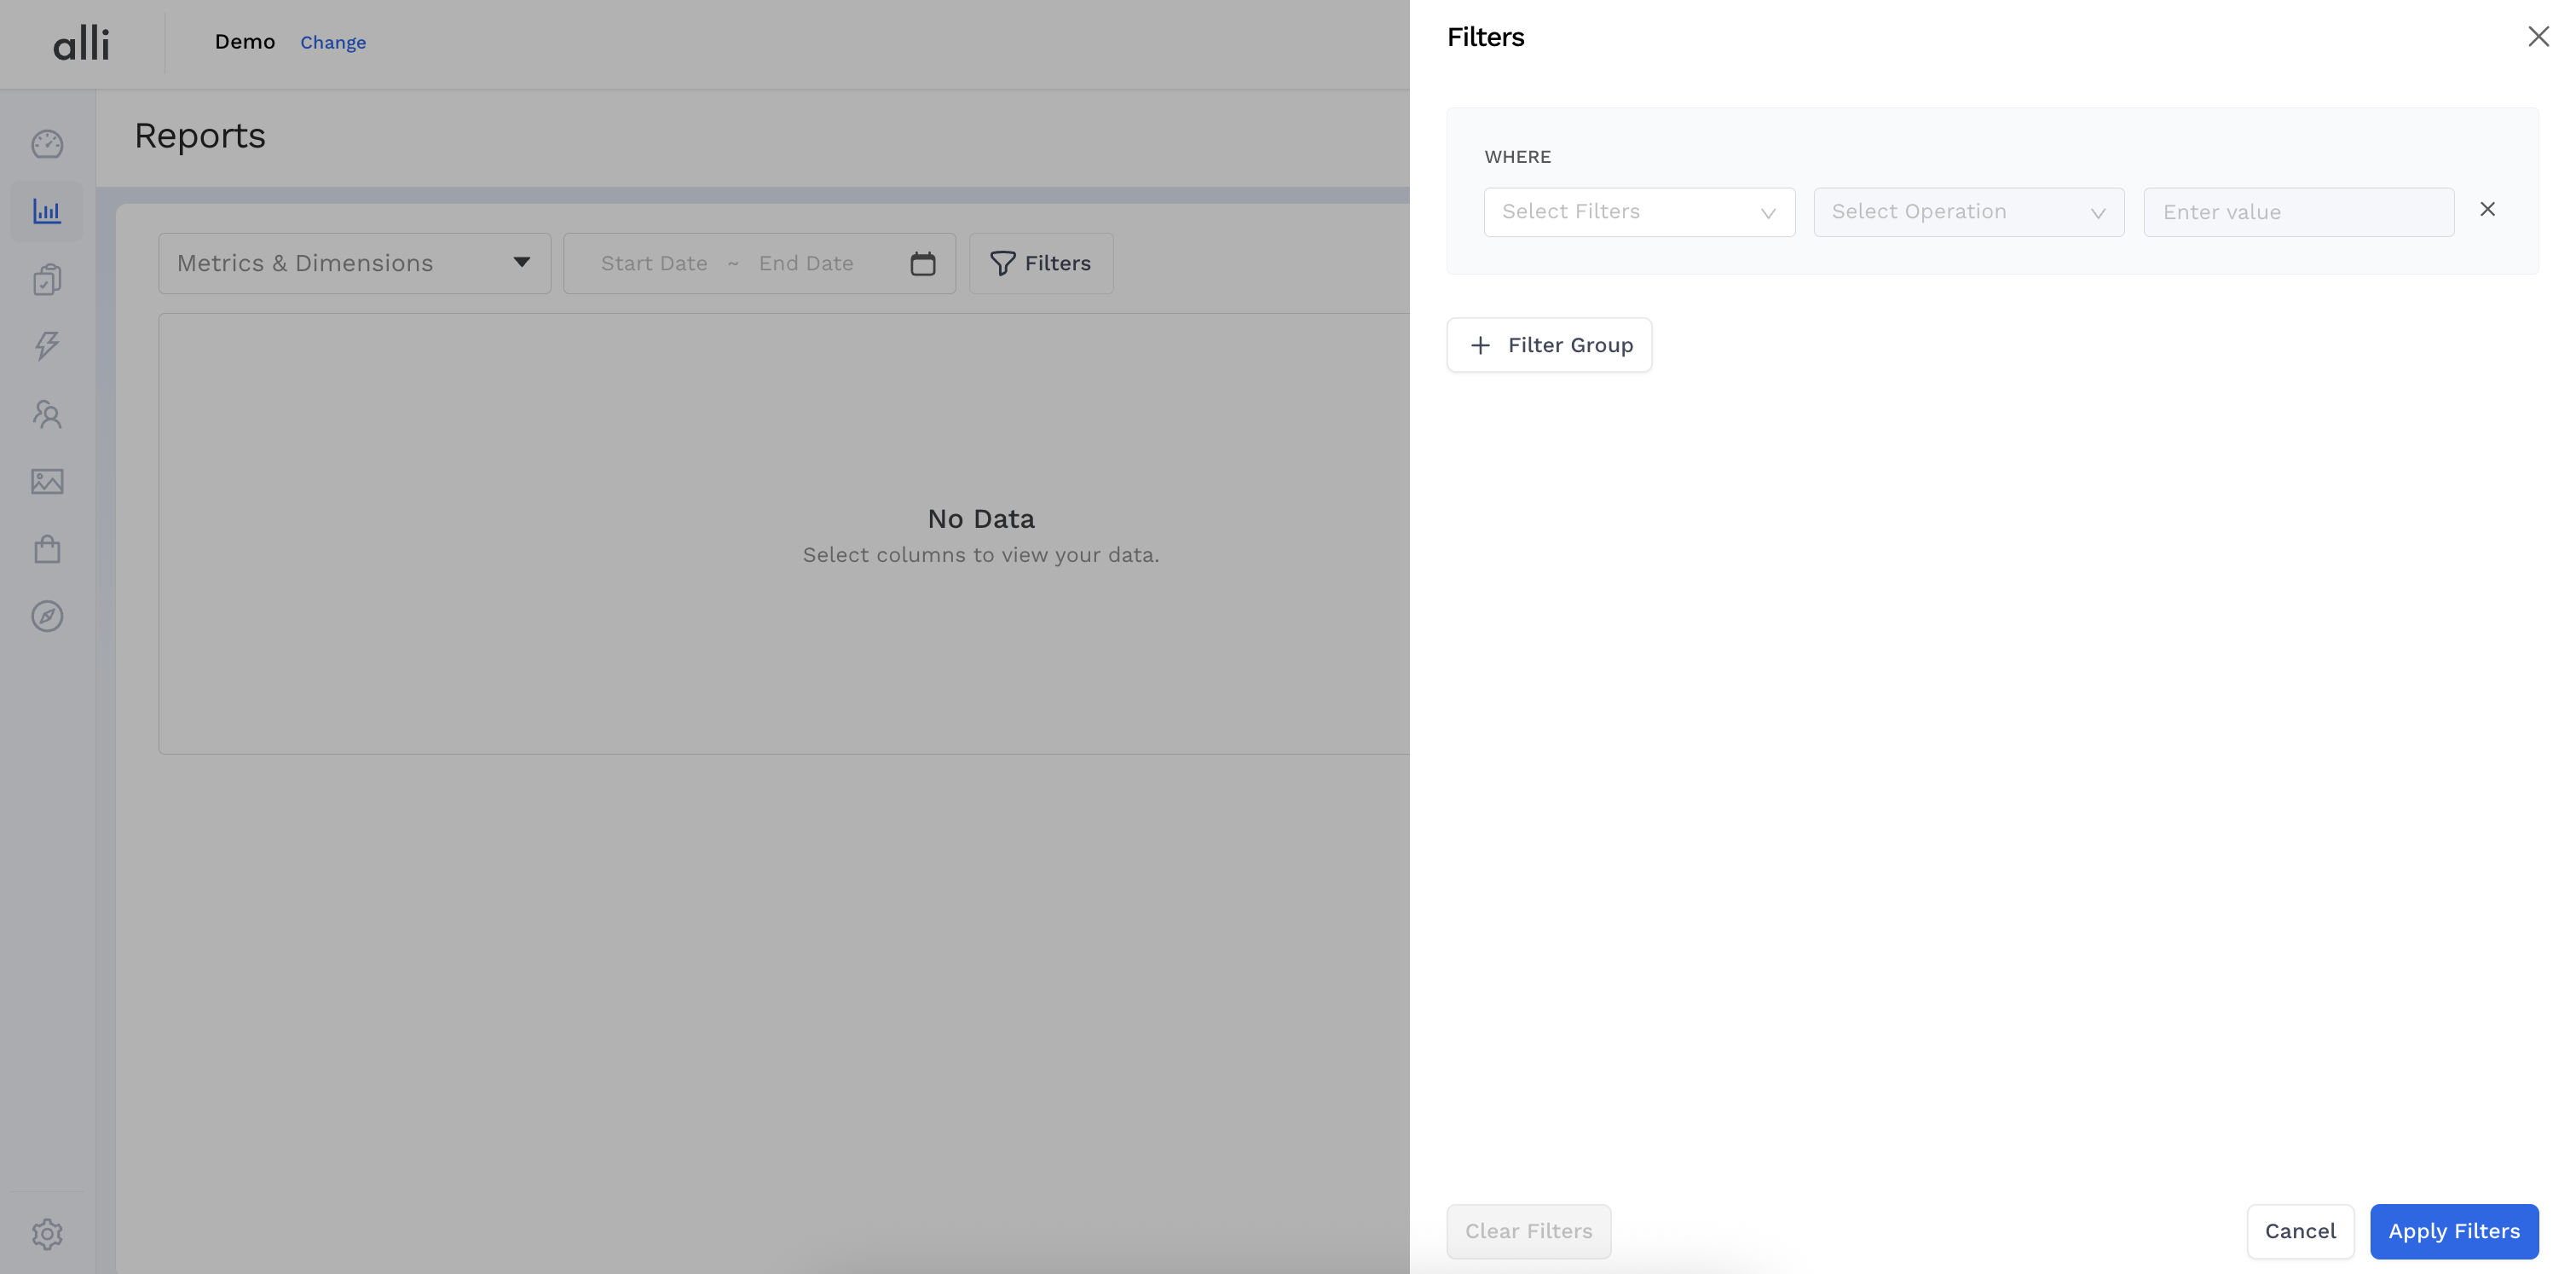
Click the Filters button to open up the filter configuration panel.
-
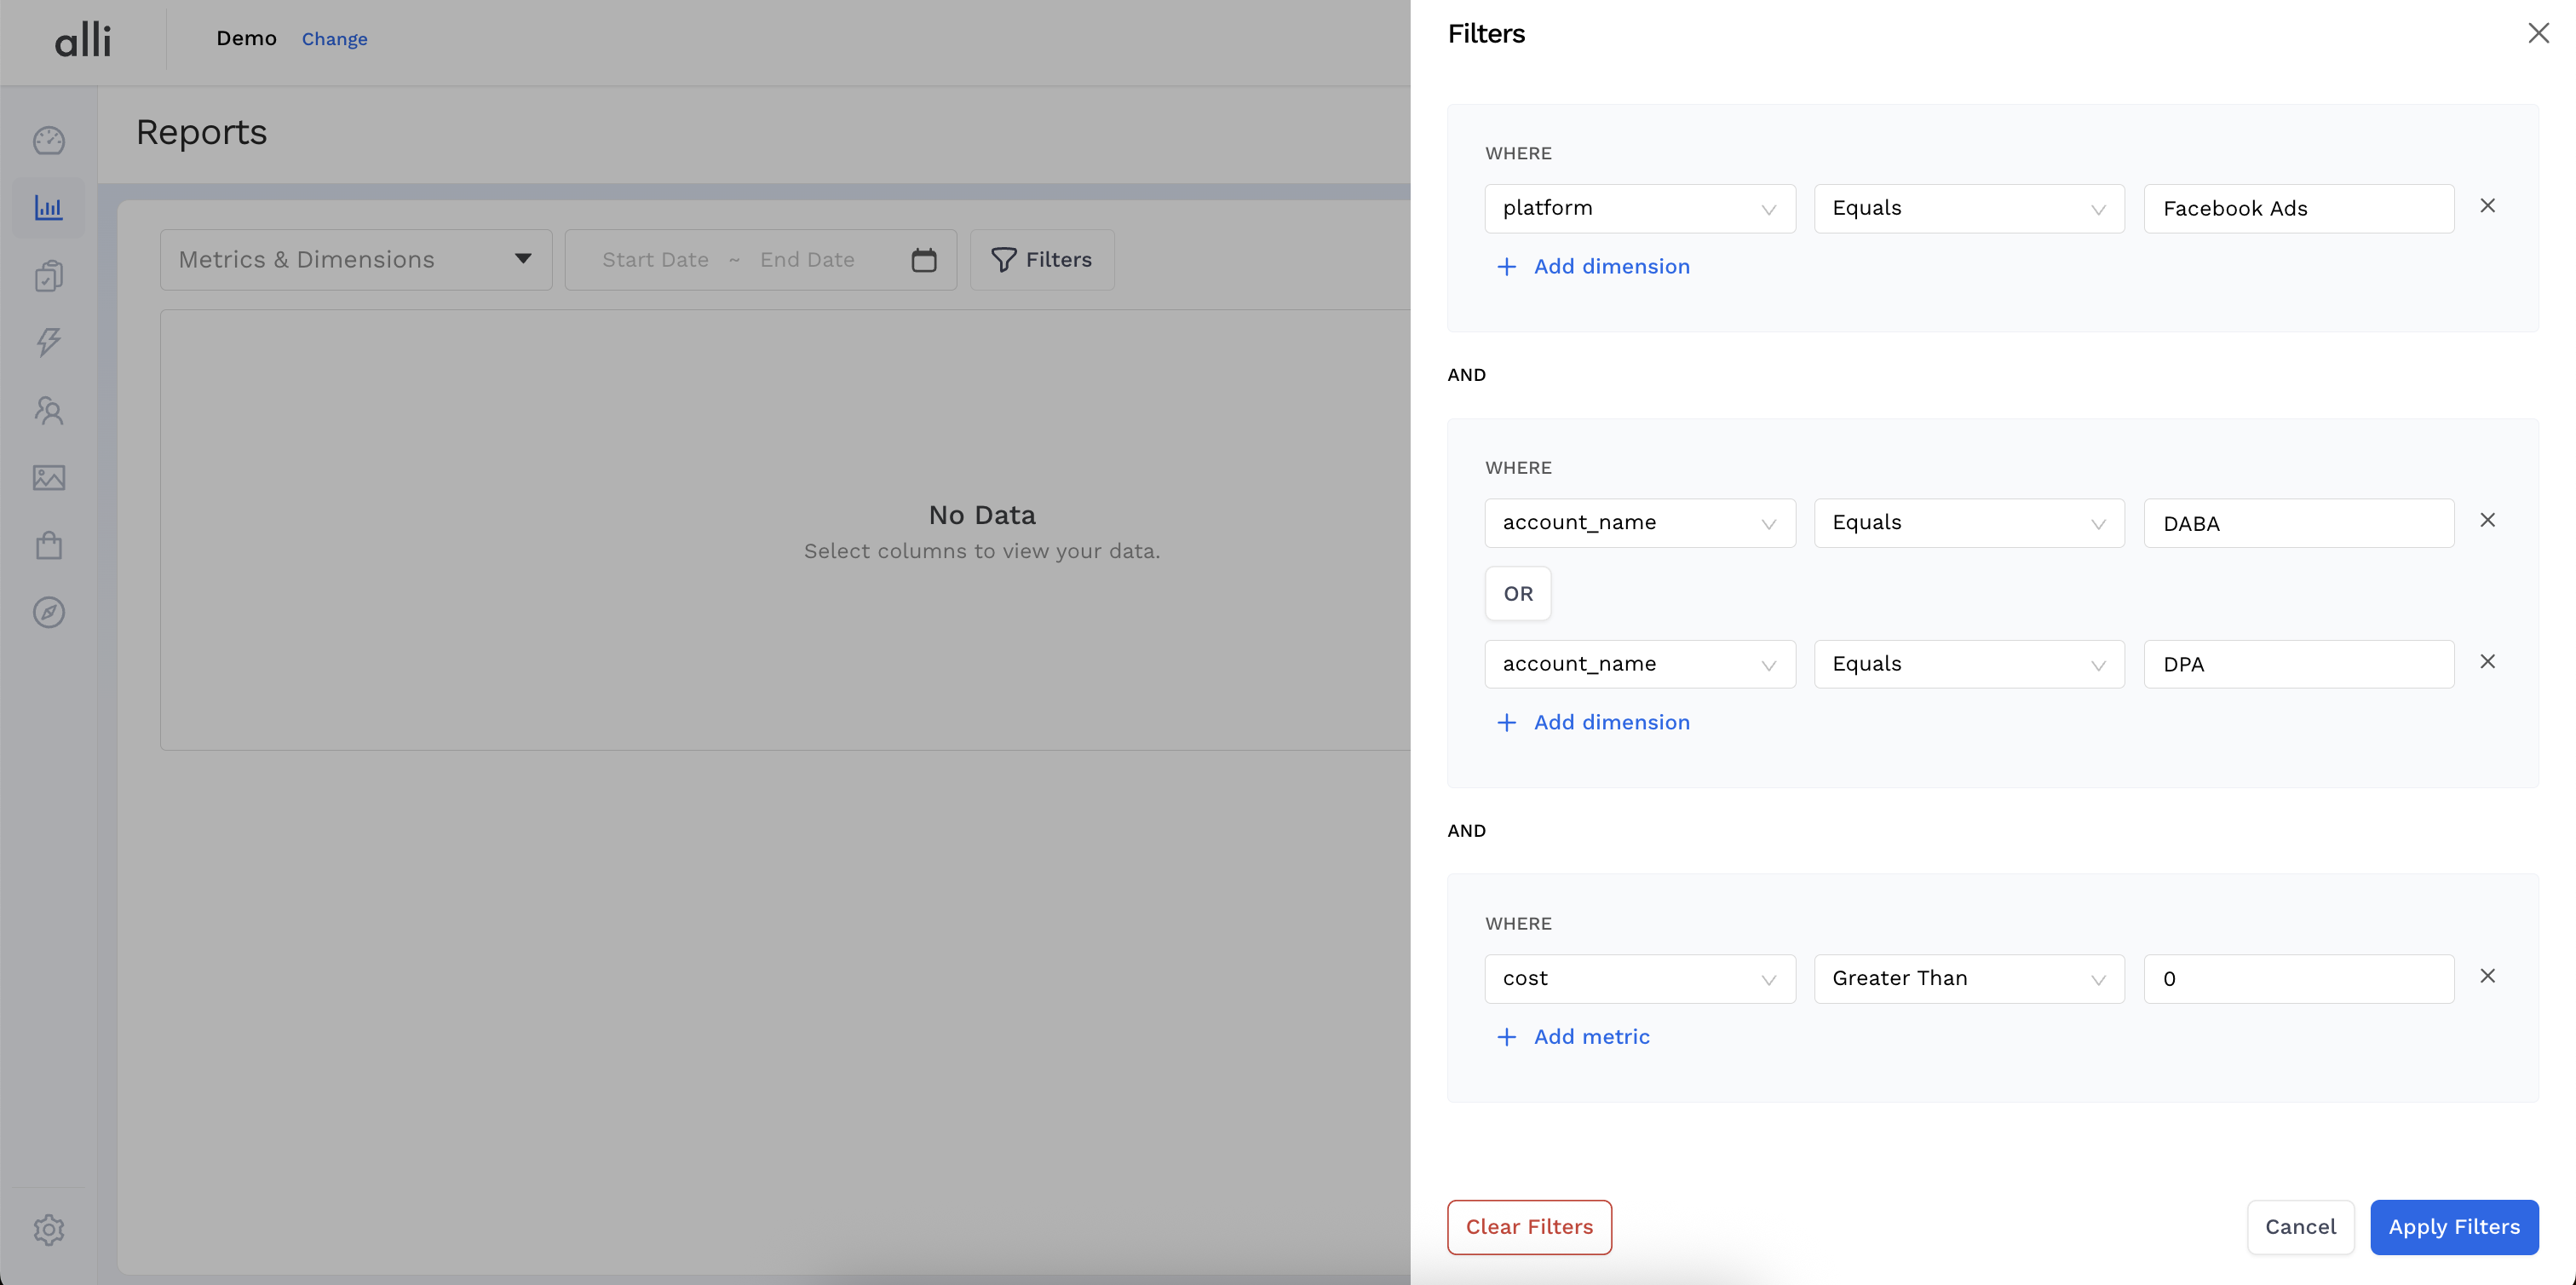
Here is where you can build your Filter Groups and Filter Conditions leveraging both
ANDandORlogic.
Metrics and Dimensions cannot be combined in the same Filter Group.
-
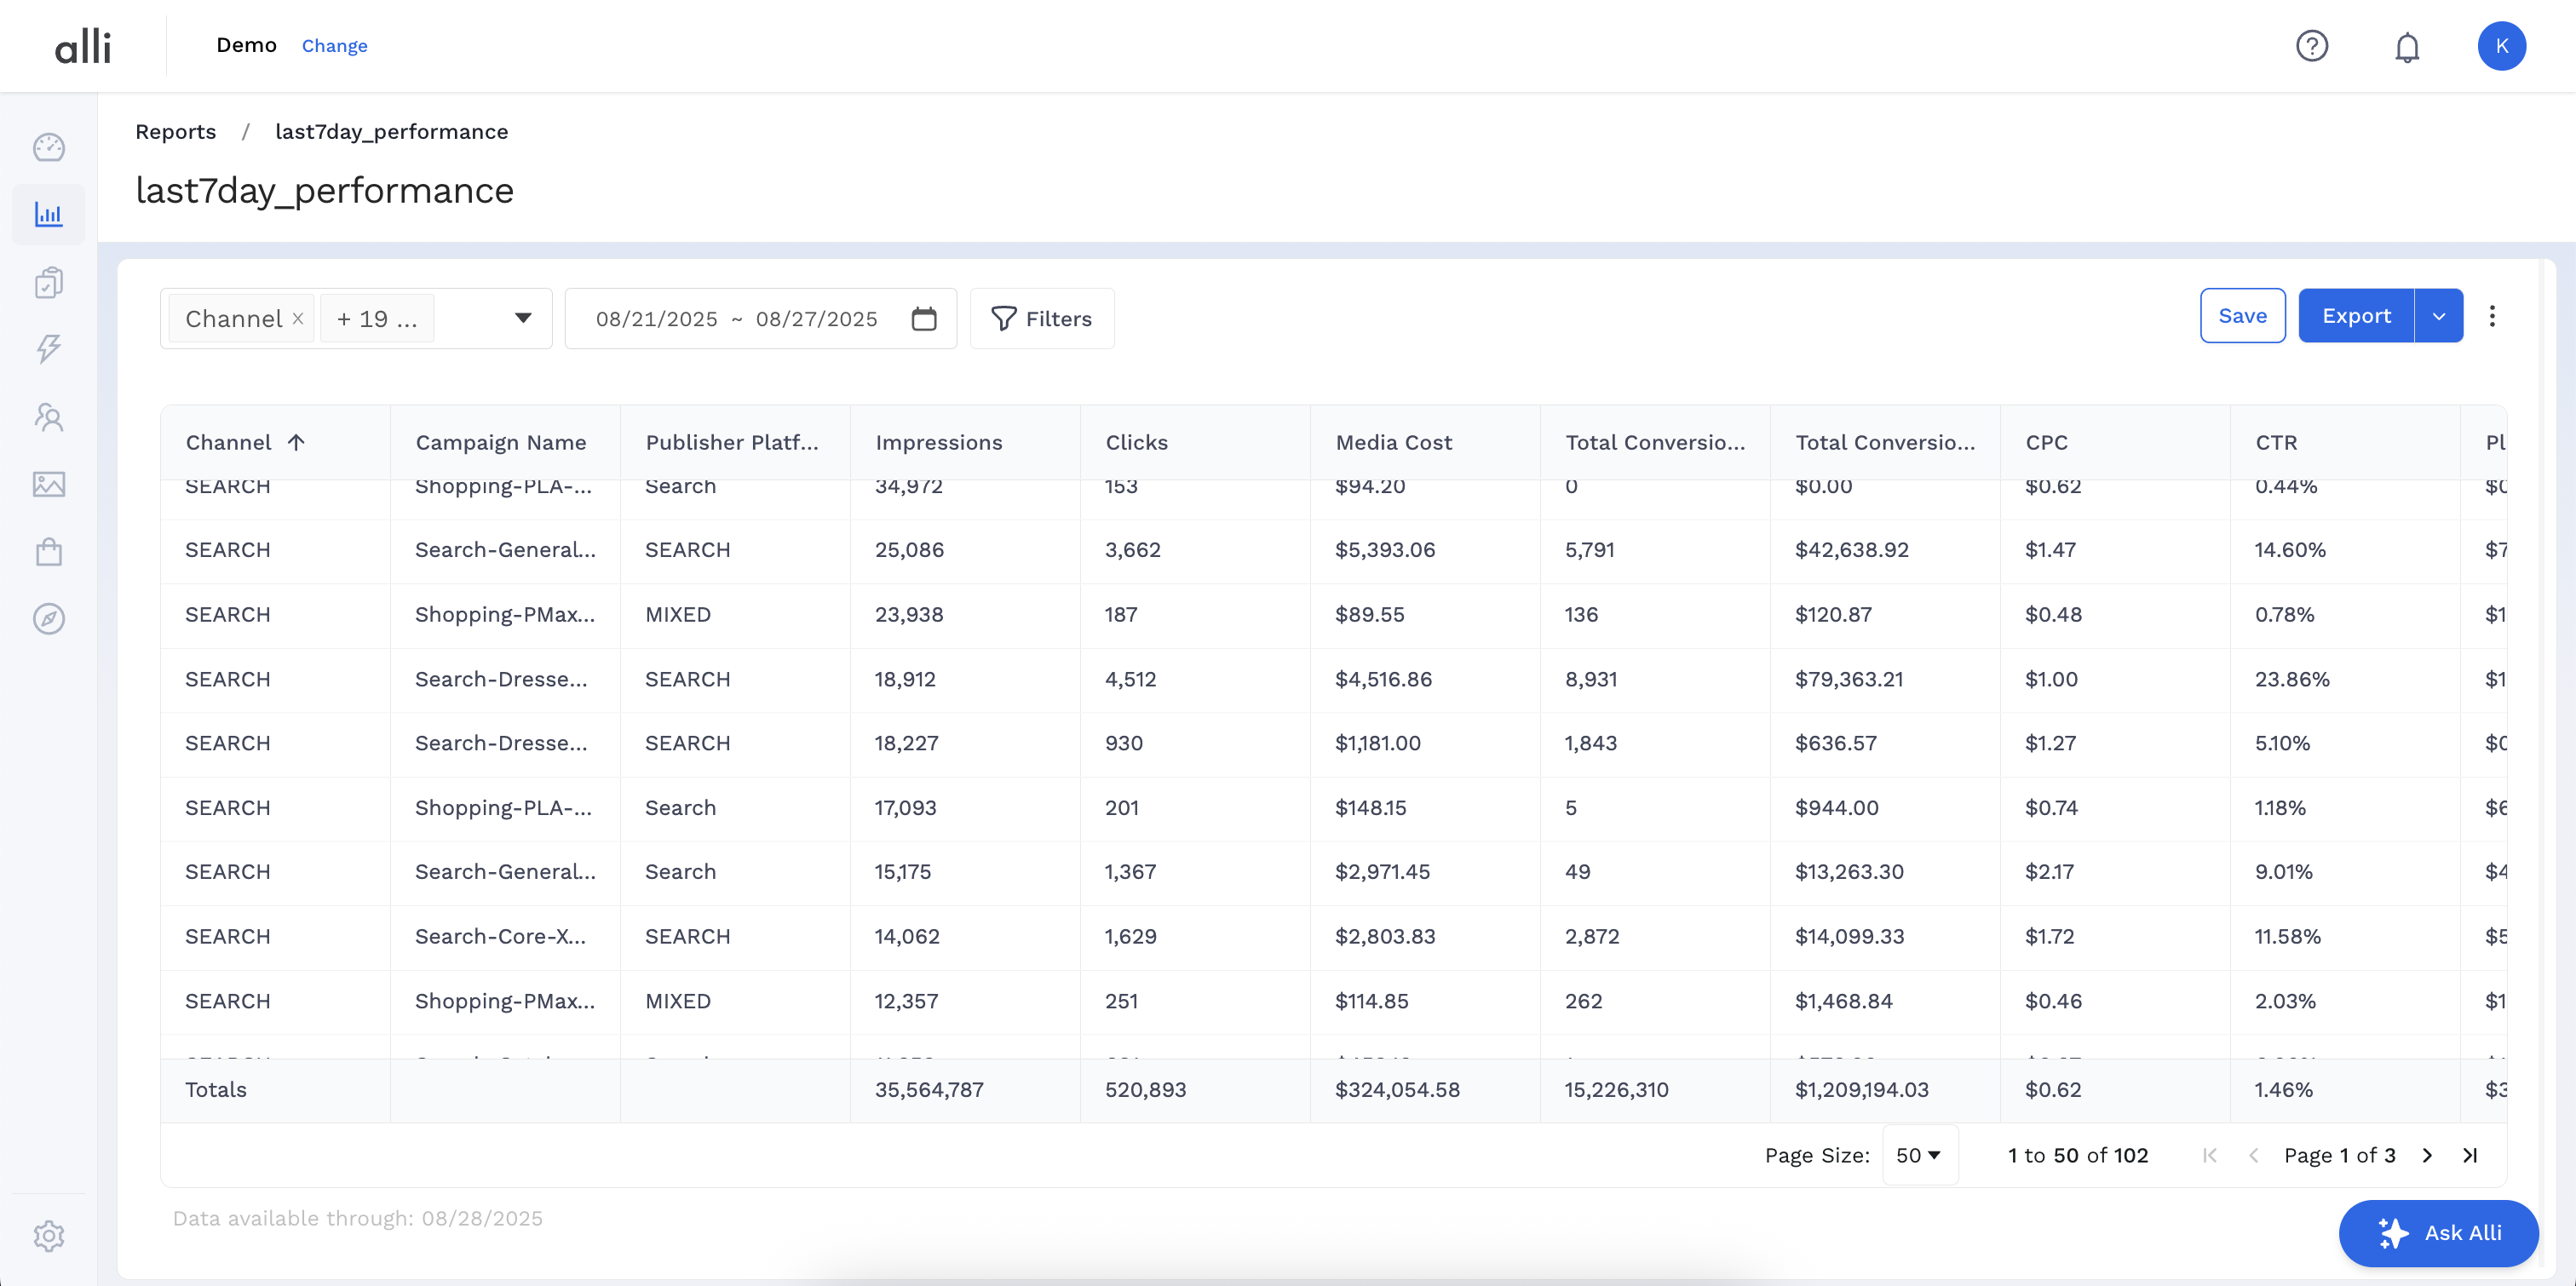
Once you’ve configured your filters, click Apply Filters and Preview to load your results.
Related articles
- How-To: Use categorizations within your custom report
- How-to add a new datasource to an existing Data Studio dashboard
- Advanced Guide: Enabling Big Query for a Custom Alert
- How-To: Name Datasource Columns
- How-To: Enable Product Feed Reporting
- How-To: Include Custom DSP Cost in Display Reporting
- How-To: Add a new categorization
- Tutorial: Getting started with Explorer Reports
- How-To: Backfill a datasource
- How-To: Categorize CM360 Conversions
- How-To: Create a new datasource
- How-to Create a Sentiment Dashboard from FB Sentiment
- How-To: Identify Which Platforms and Report Types are Enabled for Reporting
- How-To: Enable Device and Demographic Reporting
- How-To: Manually upload data to an existing datasource