
Overview
With rolling dates in Data Explorer’s Report Builder, you can create reports that automatically adjust to display data for the most relevant date range, ensuring your insights stay up-to-date and aligned with your needs.
Instructions
-
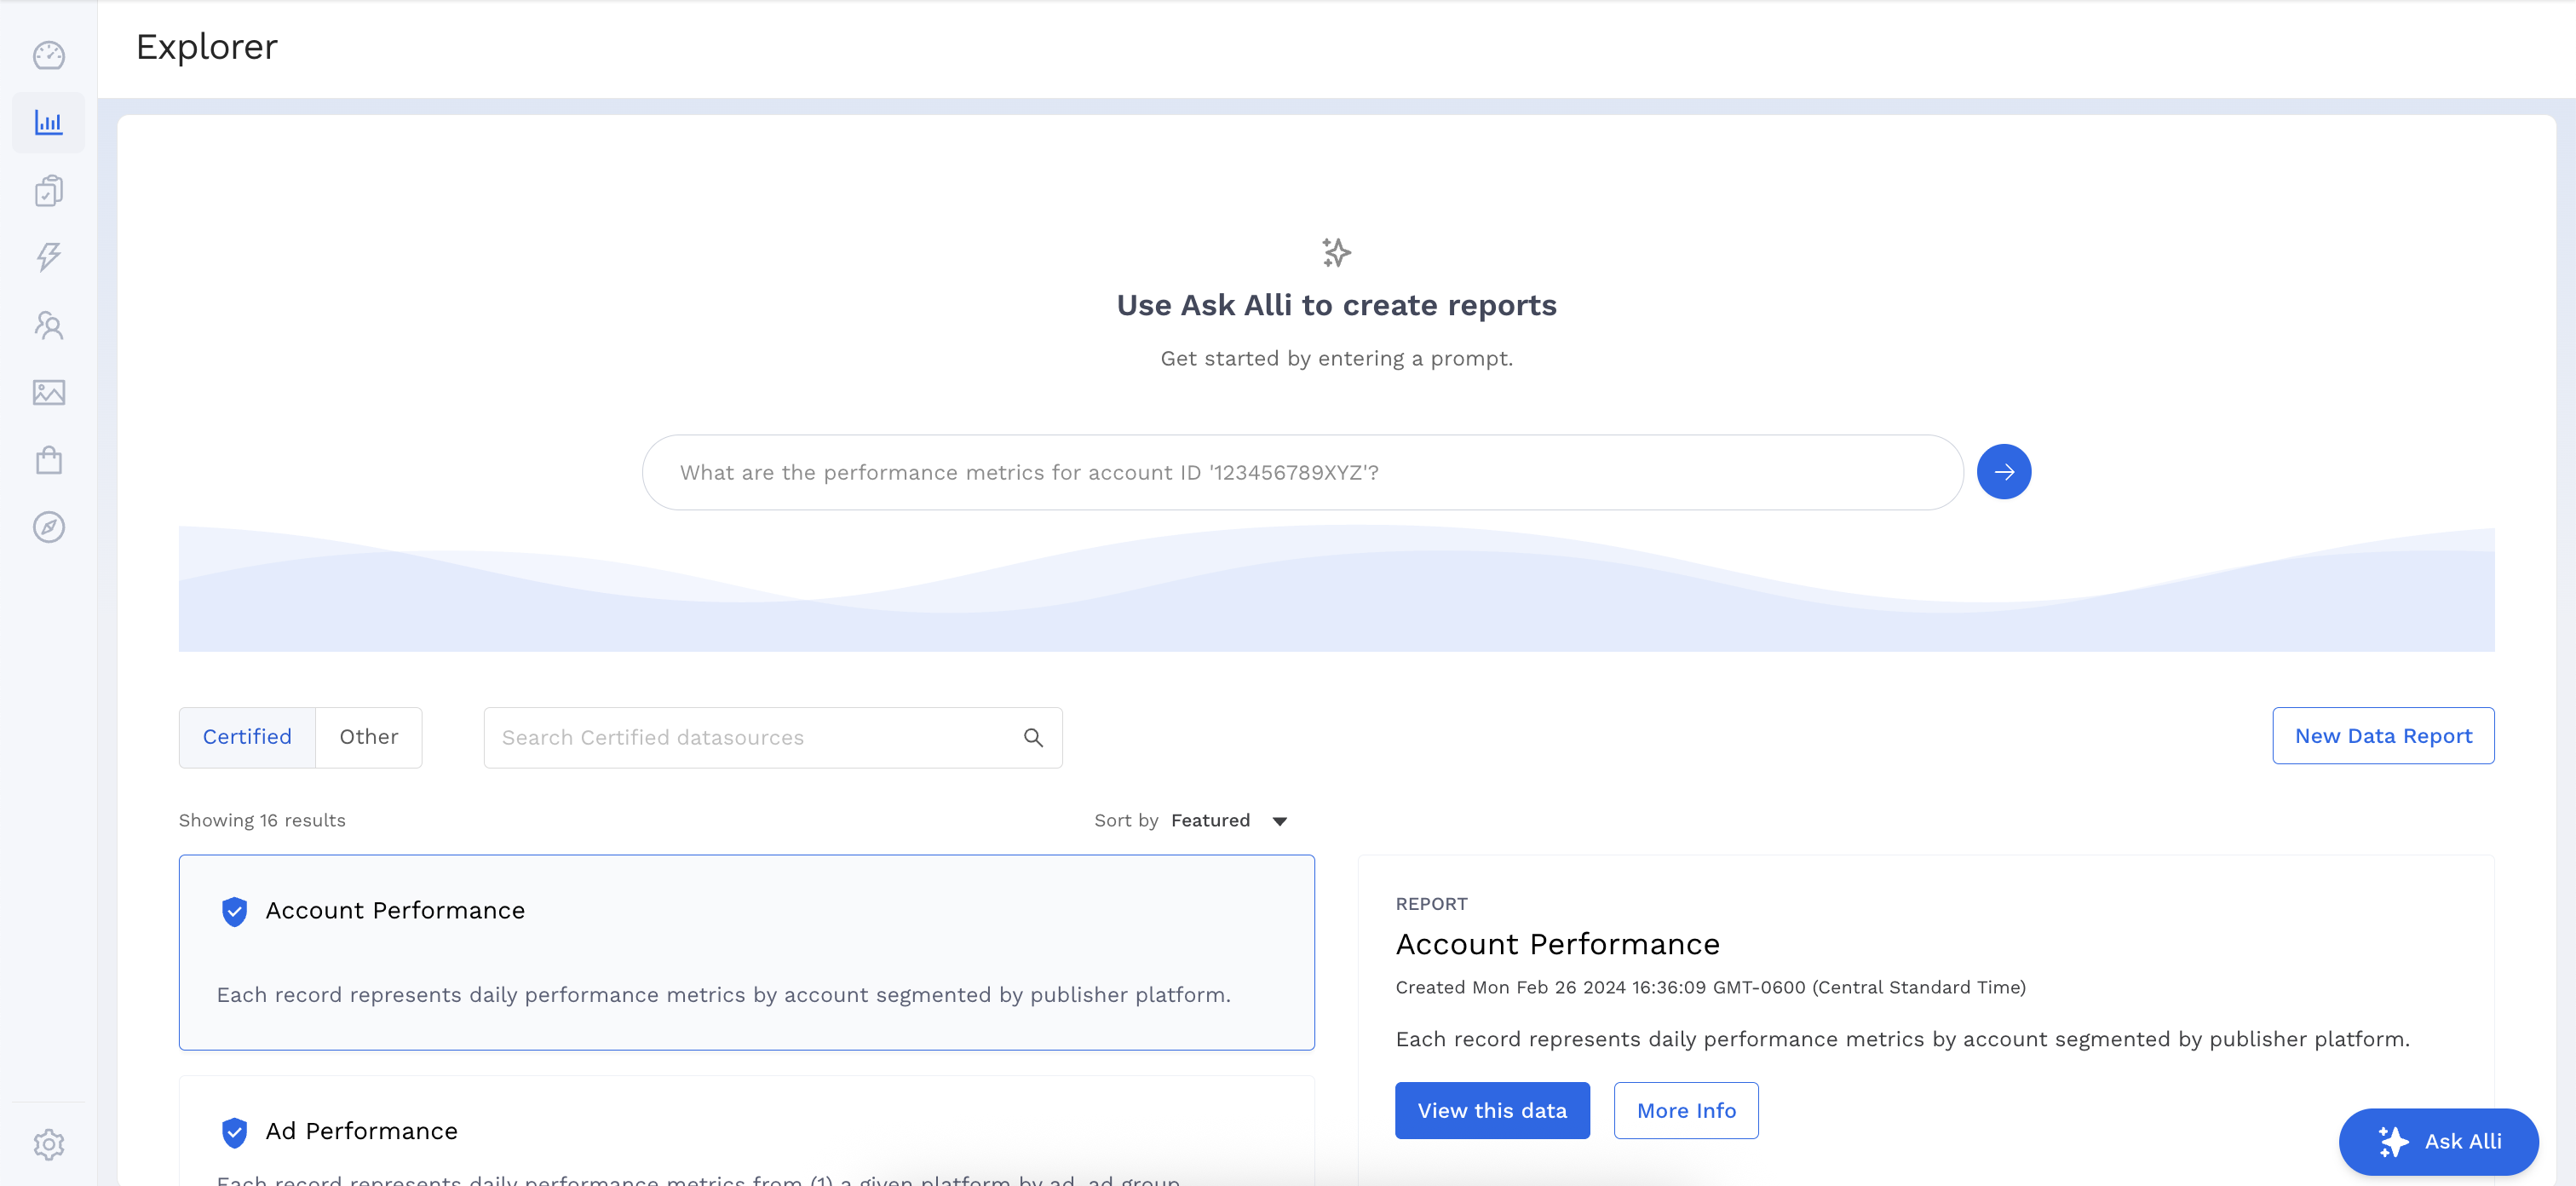
Select a datasource to work with by clicking the View this data button.
-
Add the Dimensions and Metrics you want to appear in your report.
-
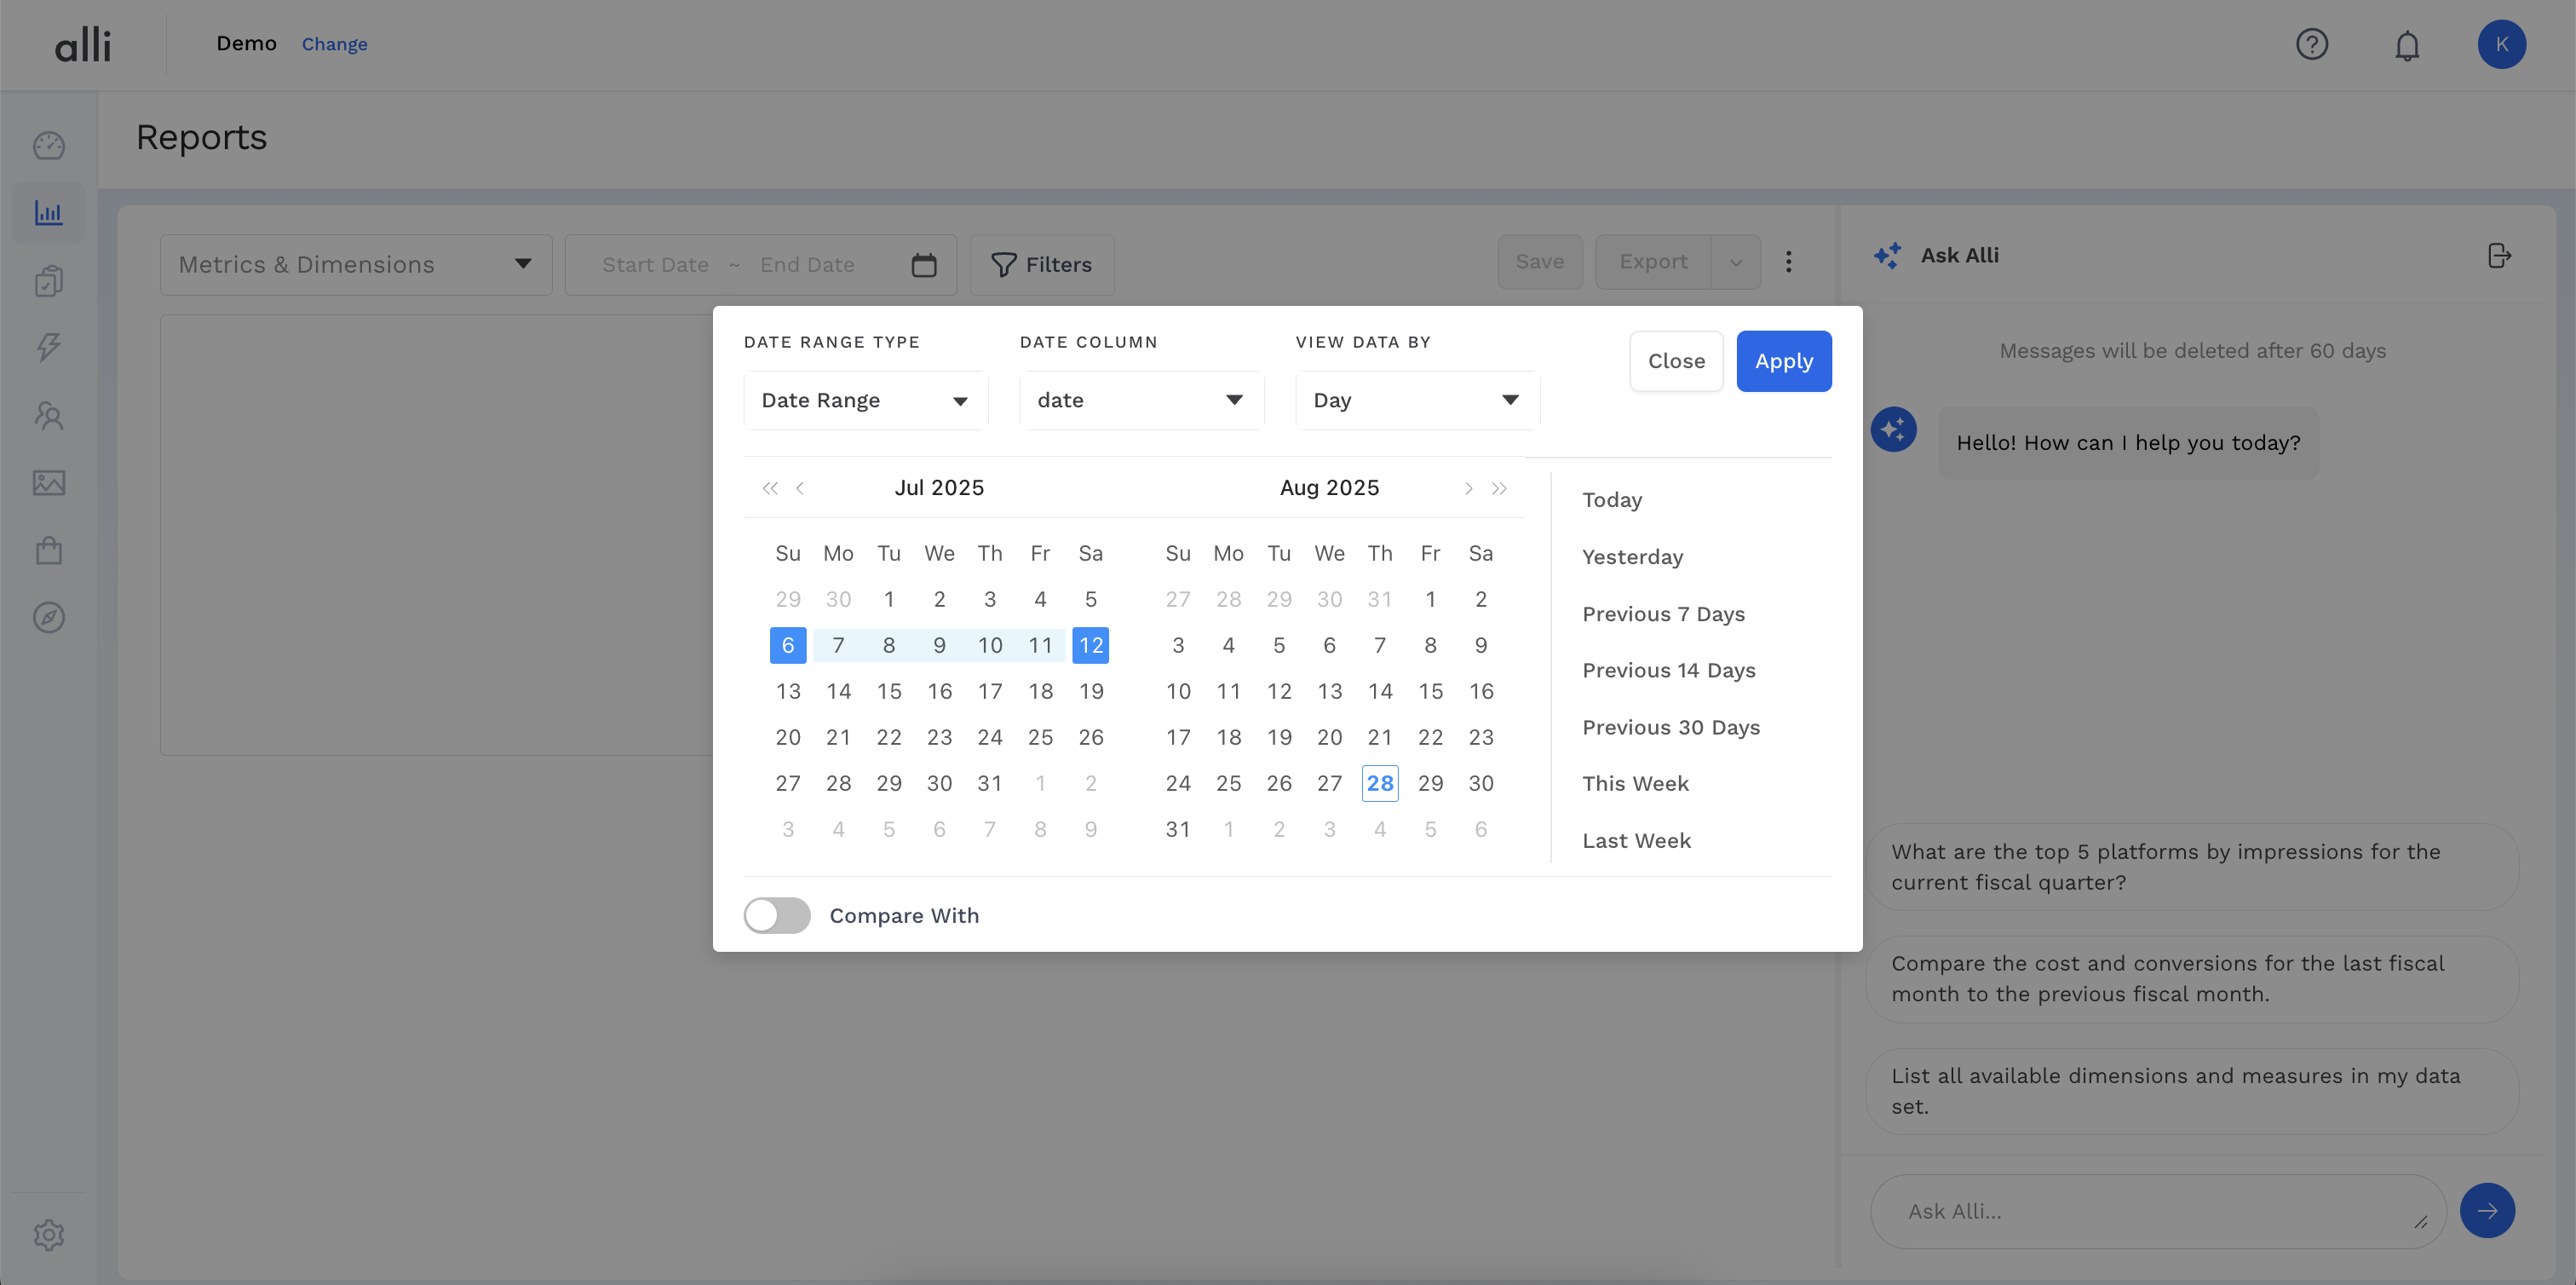
Select the Date Range Dimension to indicate which date column to use for the date selector.
-
Select Date Range input and choose from one of the preset rolling date ranges on the right of the calendar. Click Apply and Preview to load results.
In this example, the report will always display data for the current week relative to when it is viewed.
-
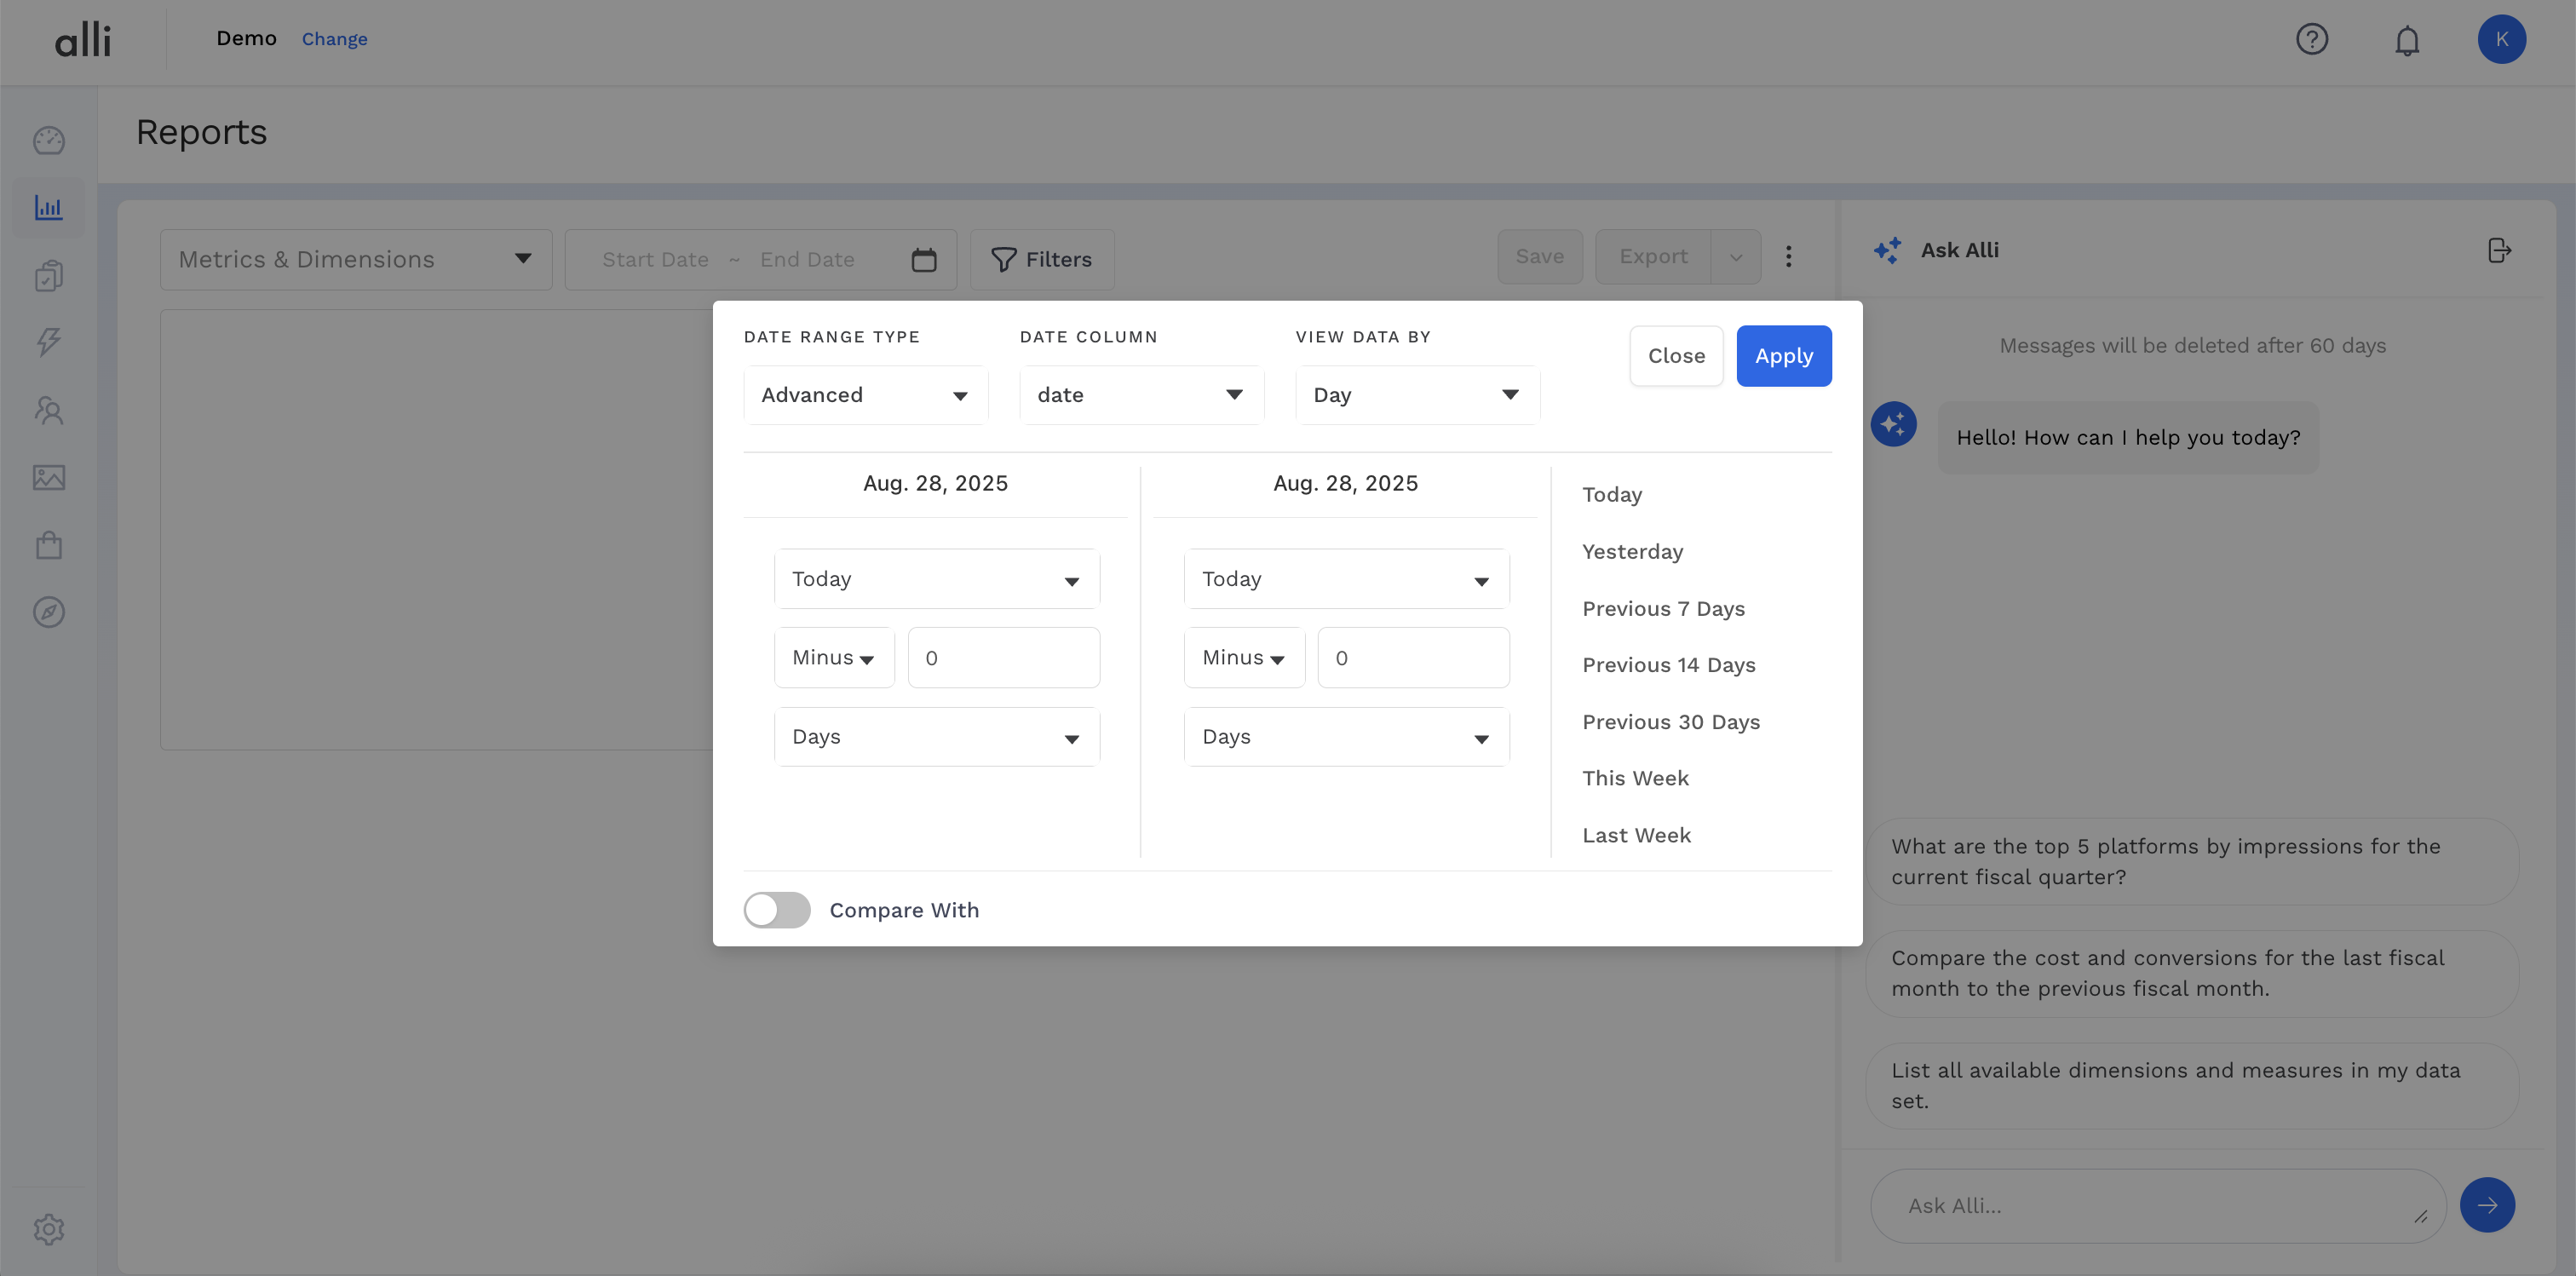
If you need a custom rolling date range, select Advanced from the drop down in the upper left of pop-up and configure your custom logic.
In this example, the selected date range is dynamically set to display data from three days ago to one day ago relative to when the report is viewed.
Related articles
- How-To: Use categorizations within your custom report
- How-to add a new datasource to an existing Data Studio dashboard
- Advanced Guide: Enabling Big Query for a Custom Alert
- How-To: Name Datasource Columns
- How-To: Enable Product Feed Reporting
- How-To: Include Custom DSP Cost in Display Reporting
- How-To: Add a new categorization
- Tutorial: Getting started with Explorer Reports
- How-To: Backfill a datasource
- How-To: Categorize CM360 Conversions
- How-To: Create a new datasource
- How-to Create a Sentiment Dashboard from FB Sentiment
- How-To: Identify Which Platforms and Report Types are Enabled for Reporting
- How-To: Enable Device and Demographic Reporting
- How-To: Manually upload data to an existing datasource