
Prerequisites
-
User creds with access to client Vistar DSP account
A shared [client]_reporting@pmg.com account is preferred over a personal account
Creating the Vistar DSP report
-
Log into the Vistar UI using the user creds that has access to the client’s Vistar DSP account
-
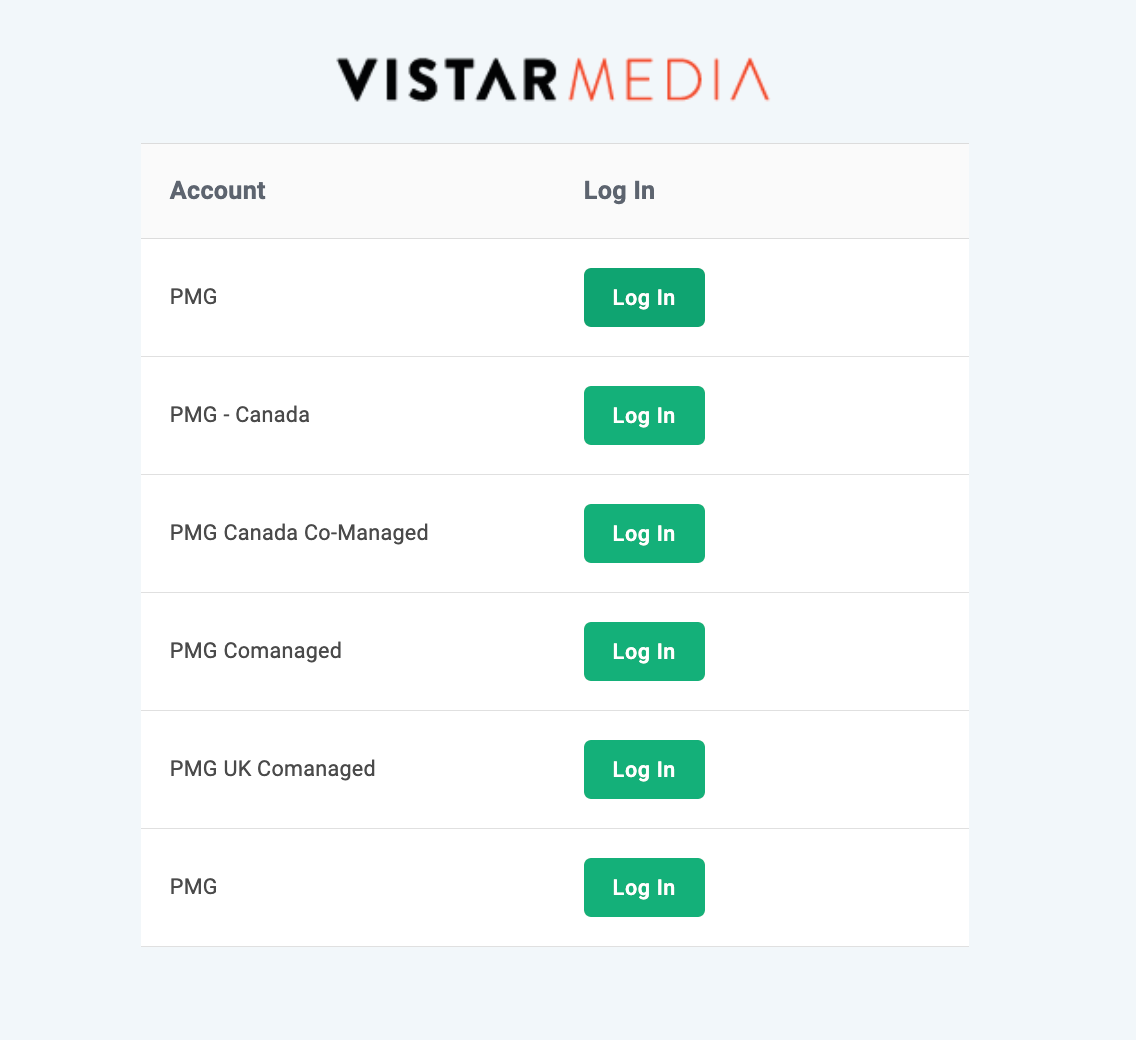
If it is a shared multi-account login, select the appropriate account:
-
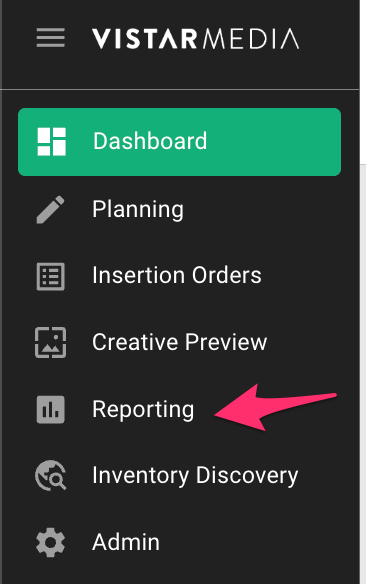
After successful login to the expected account, navigate to the Reporting section:
-
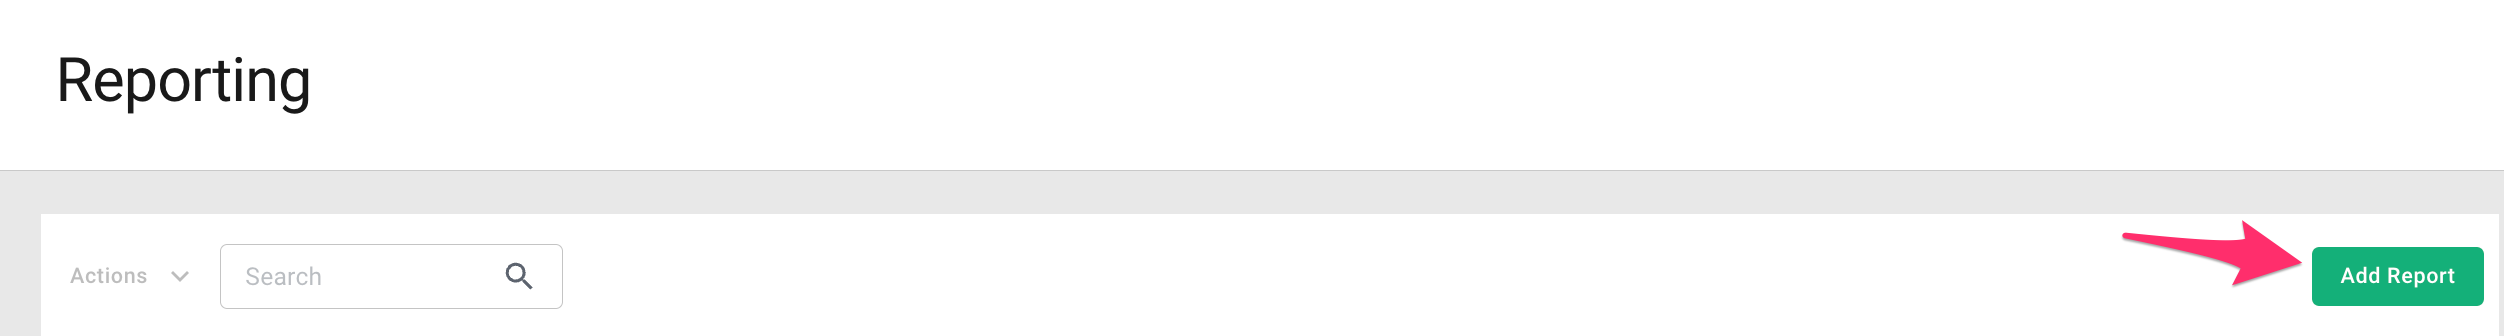
Click on “Add Report” to create a new report:
-
Build out the report with the following criteria:
-
Date Range -
Last 7 Days -
Time Zone -
Default -
Filter -
Select the advertiser you wish to create report for (i.e. Athleta, Shake Shack) -
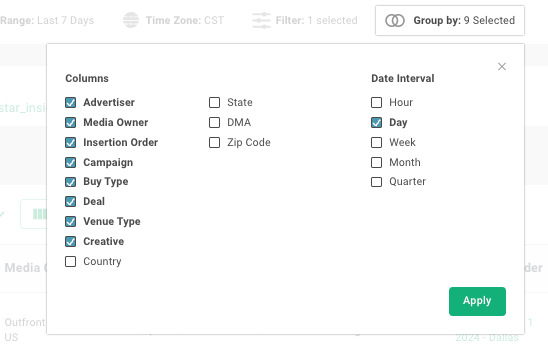
Group By: Select the columns checked in below screenshot! Select
"Day"as theDate Interval
-
-
Click
Load Report -
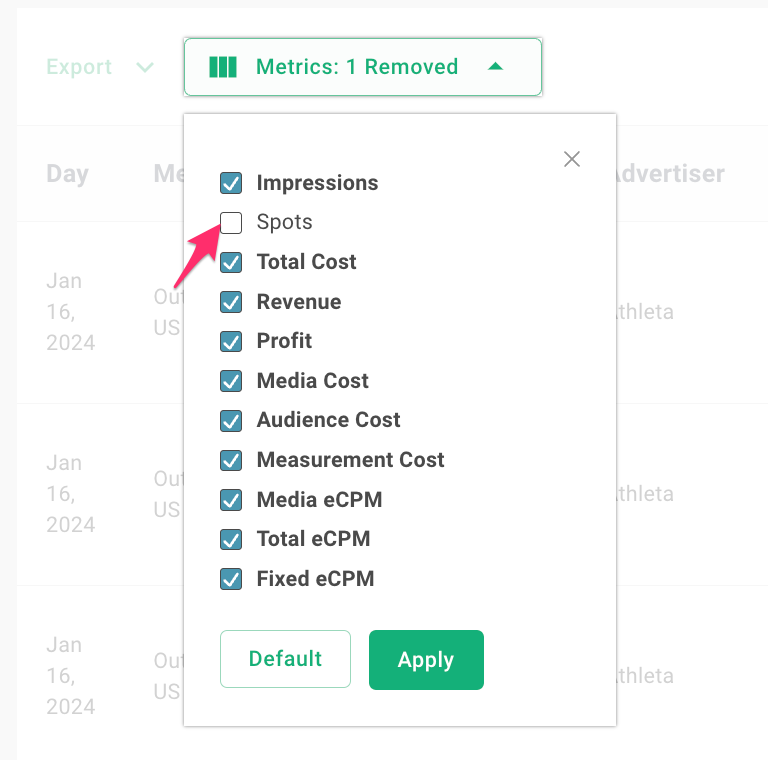
Add
Spotsin to metrics selection by clicking onMetrics: 1 removed, checking it and then clicking Apply:
-
With all of the columns selected and all metrics checked, click
Save Report-
Report name -
ADL - vistar_insights_ad - {client_name} -
Public -
check if you wish for it to be available to all users under account -
Click Save.
-
Creating and Backfilling the datasource
-
Open the
Alli Data Library 2.0 - Onboard Platformapp or install it if it is not already available for your client in Alli Data (follow this section Tutorial: Onboarding a Platform | Creating your datasources using Alli Marketplace for detailed instructions) -
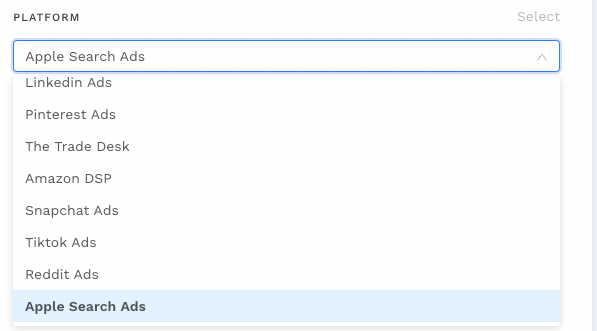
Create the Vistar datasource by selecting the
Vistar DSPoption under platform dropdown and execute theAlli Data Library 2.0 - Onboard Platformapp.
-
Locate the datasource that was created
-
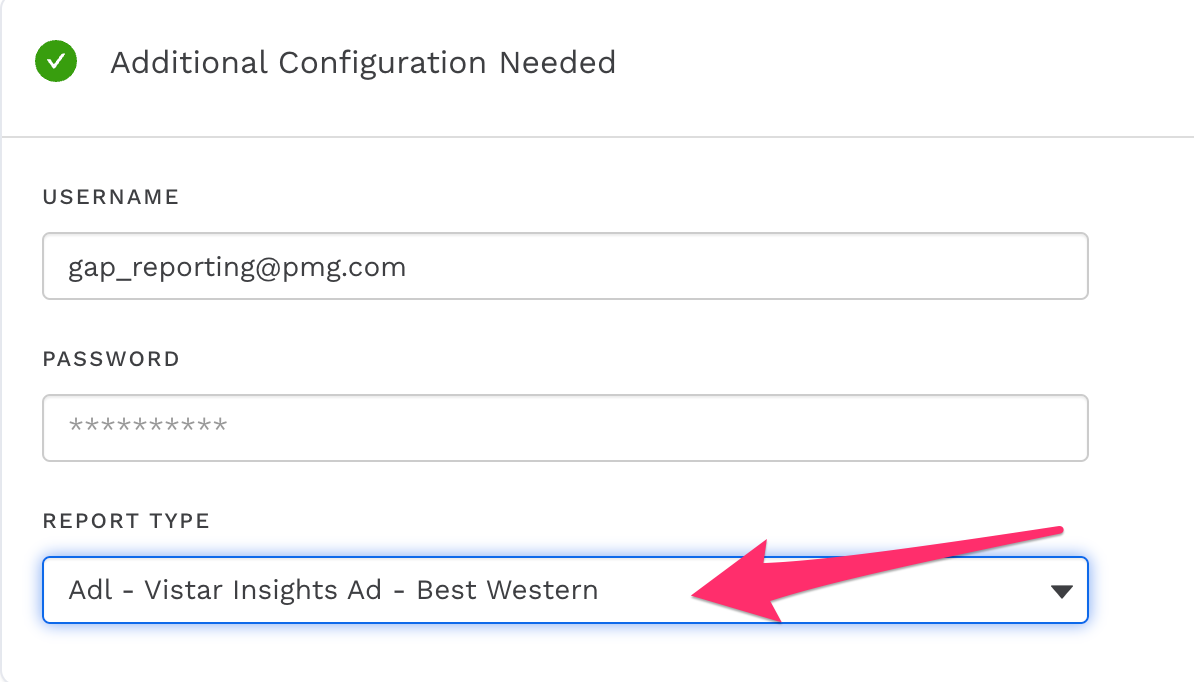
Authenticate datasource using the Vistar DSP Reporting UI creds.
-
Select the report you created using the previous steps above (
ADL - vistar_insights_ad - {client_name}):
-
Click on Save.