
Overview
Ask Alli is your built-in assistant for exploring data in plain language. Whether you're answering quick questions, building campaign summaries, or analyzing performance across dimensions, Ask Alli makes it faster to get to insights — no filters, pivot tables, or dashboards required.
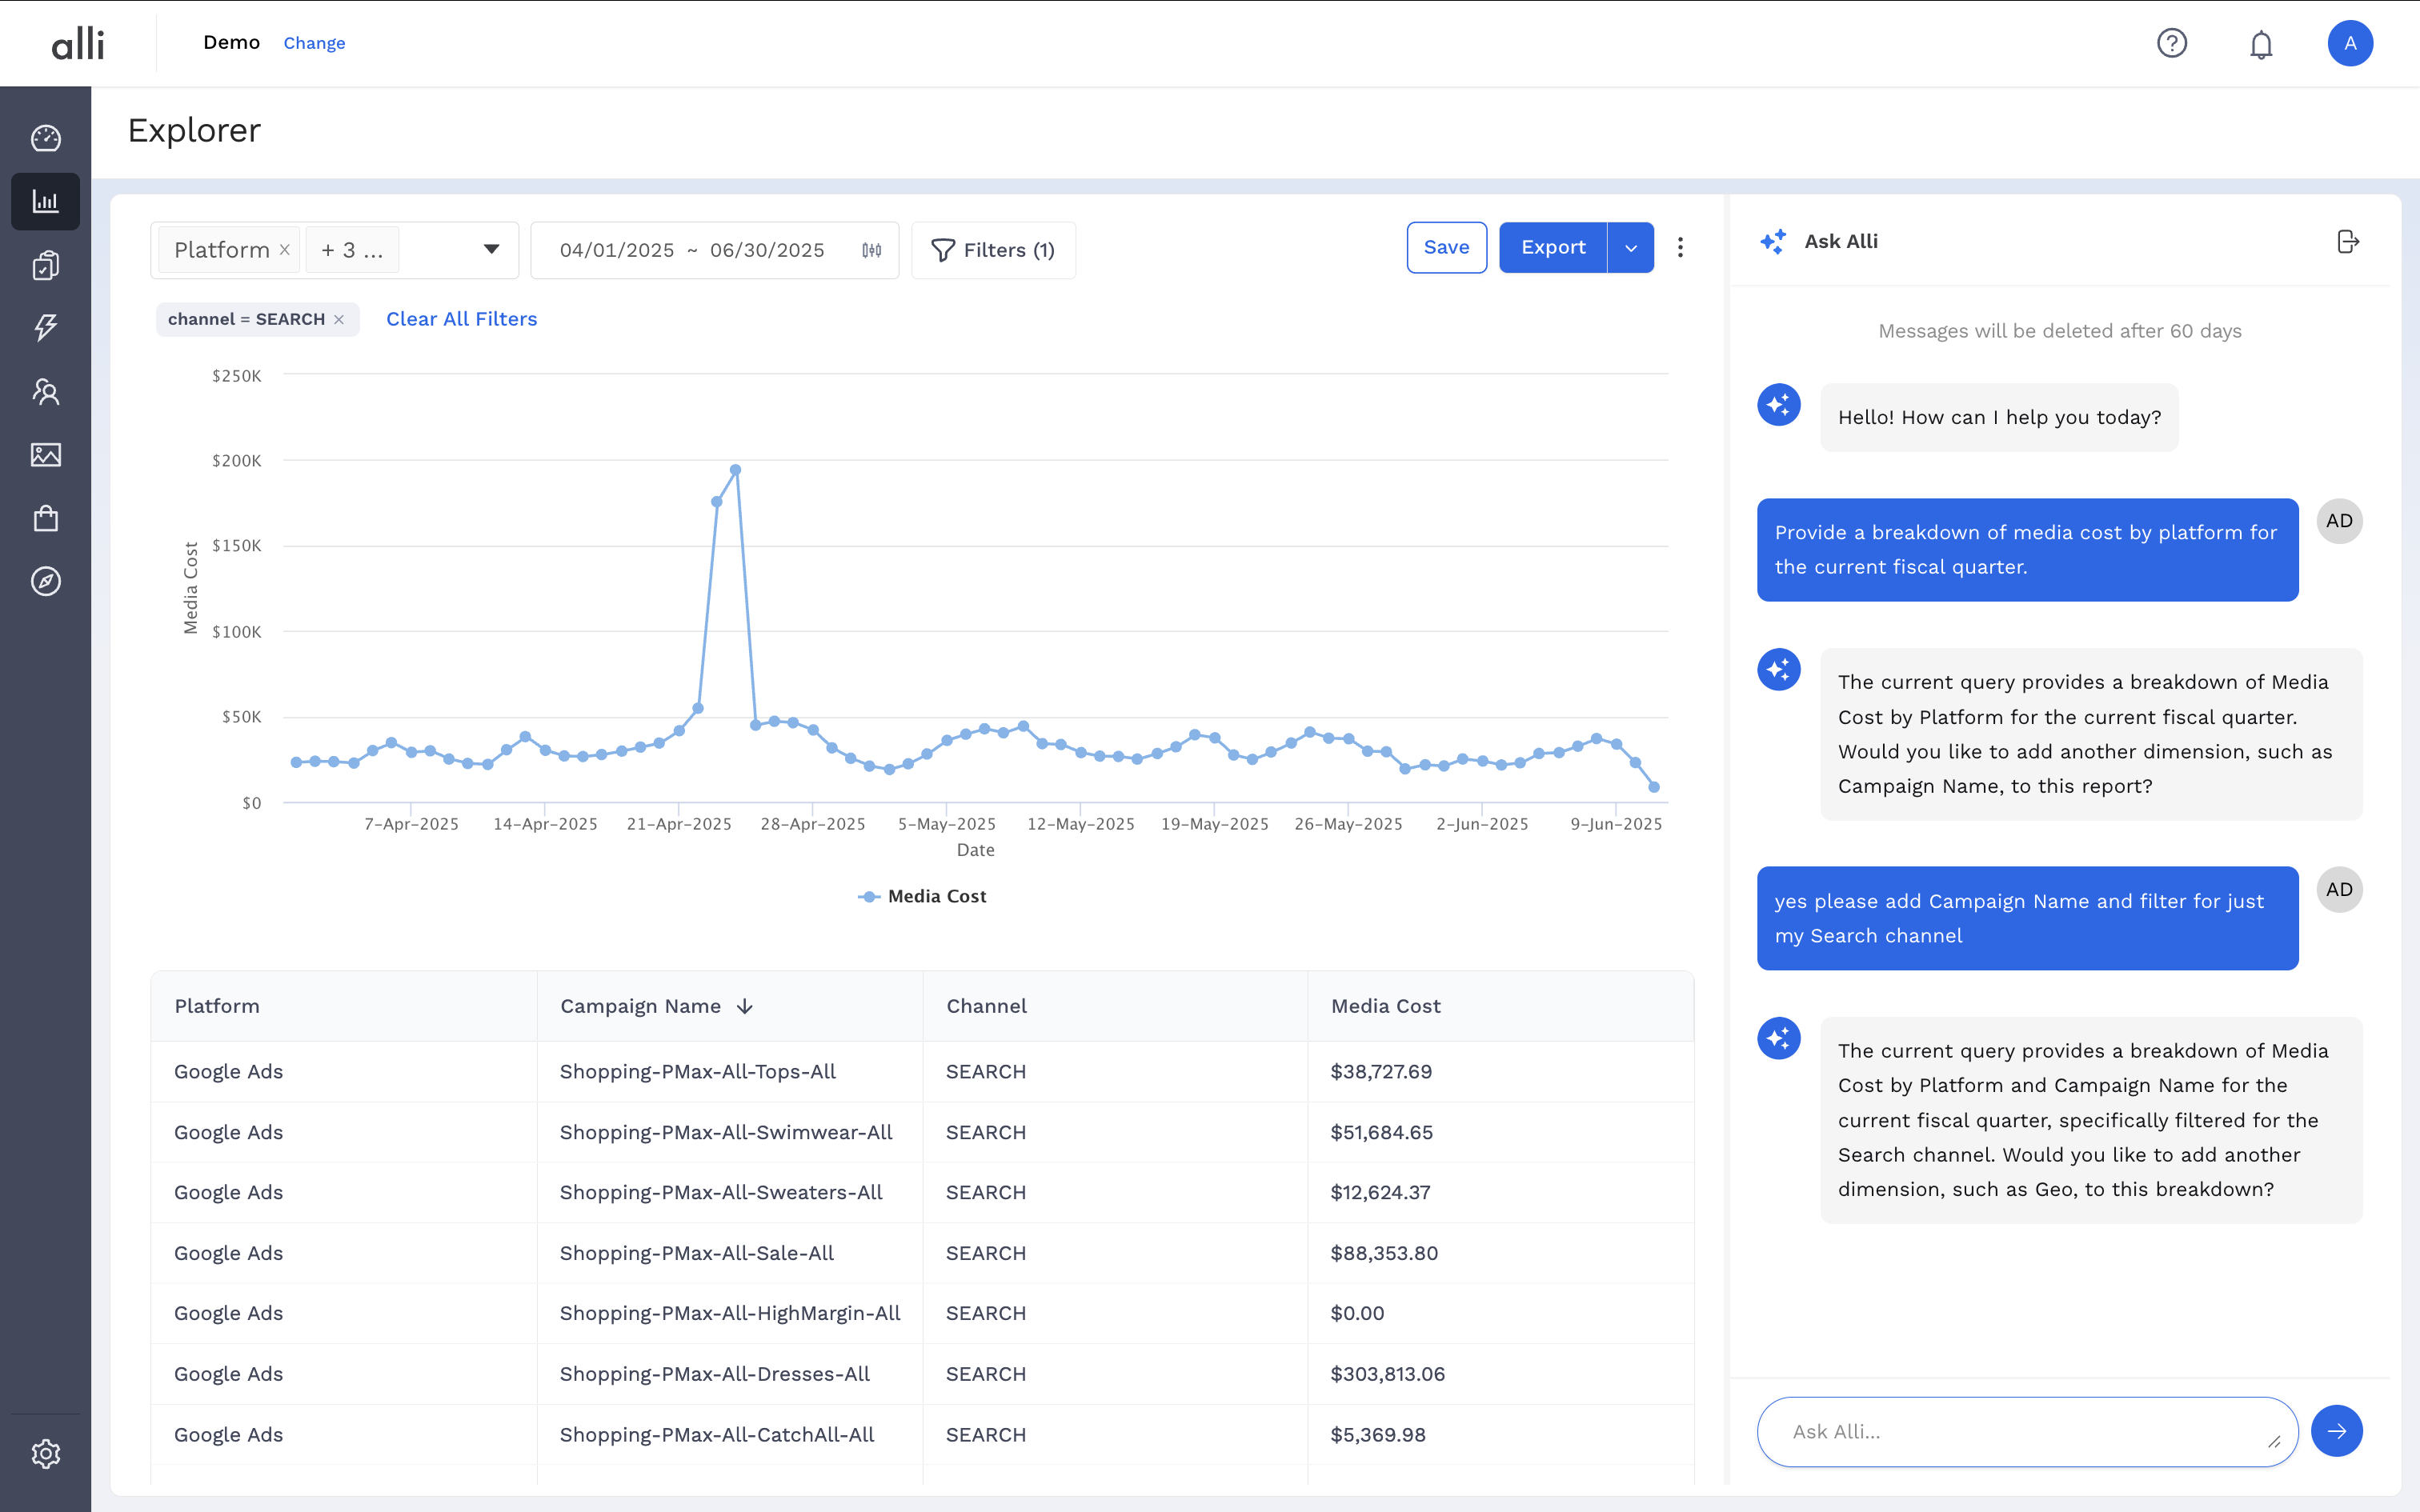
Type a question, and Ask Alli will return a chart, table, or summary in seconds — all based on the same data used across the Alli platform.
When to Use It
Ask Alli is perfect for:
-
Spot checks and quick analysis
-
Comparing performance across time periods, platforms, or audiences
-
Building charts for client reporting
-
Setting up queries to use for an Alert or Export
Instructions
-
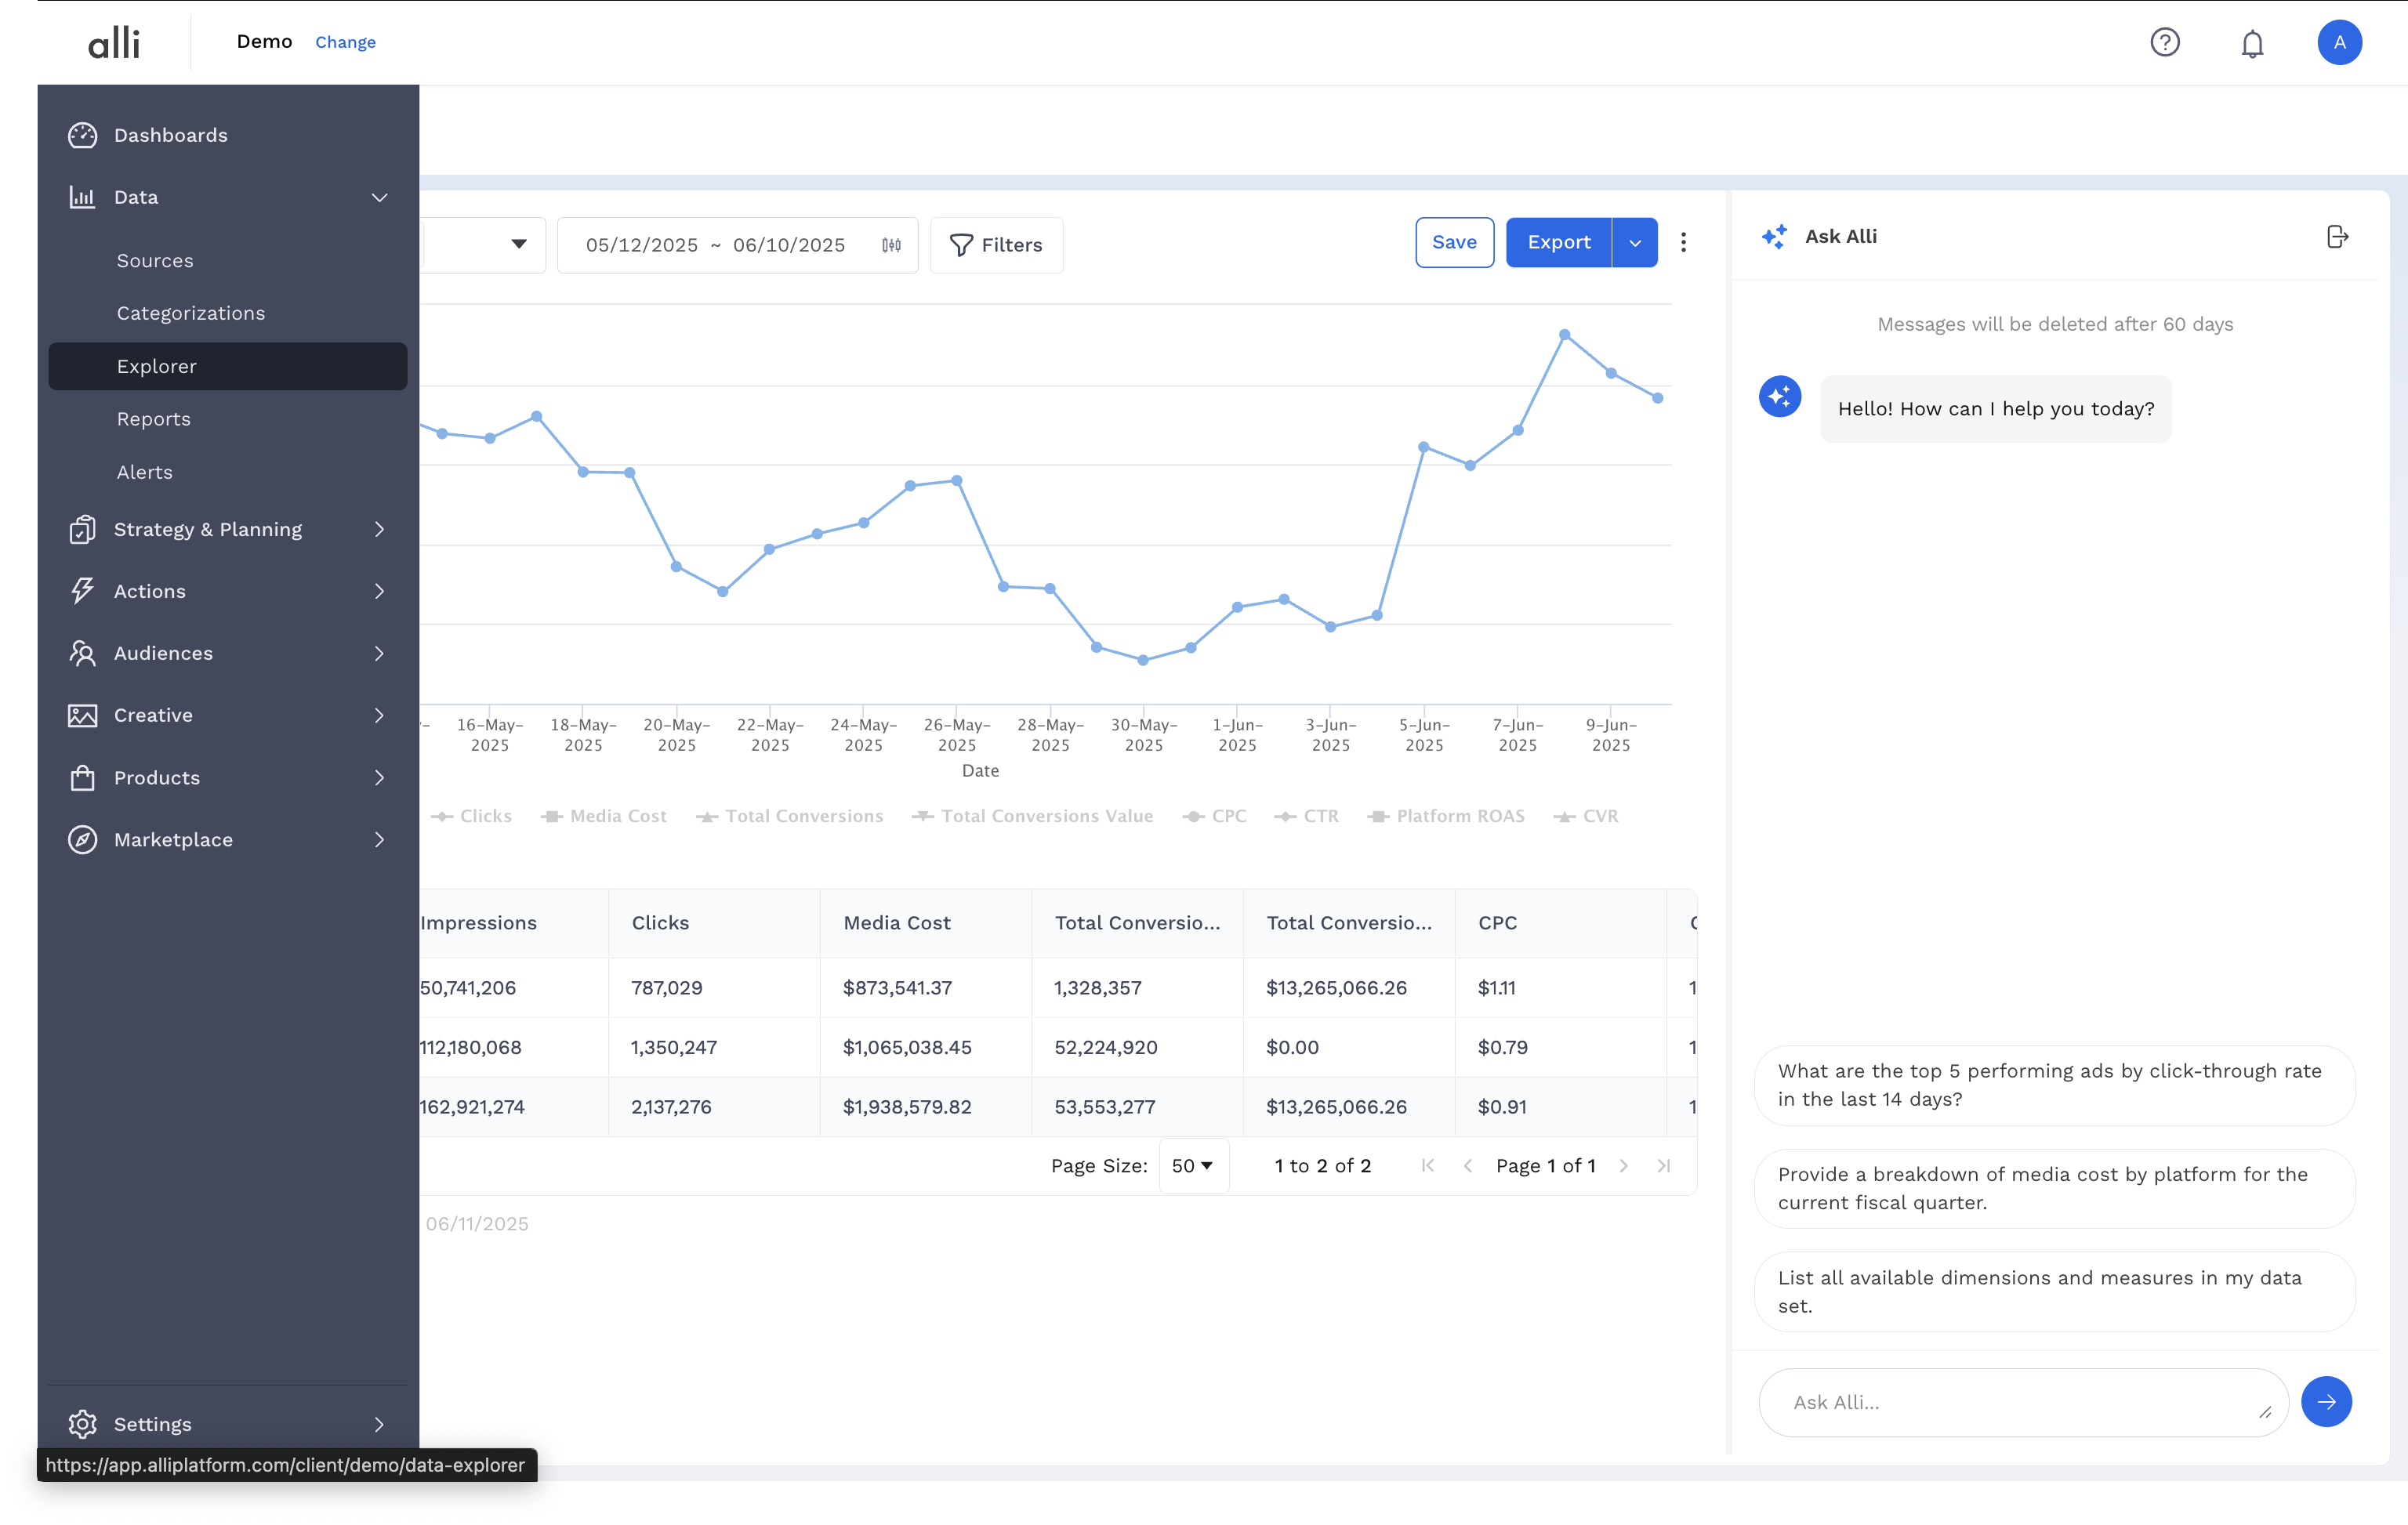
Navigate to Data Explorer from the left side navigation panel.
-
Select from one of the existing prompt starters or type your own question and review the results generated.

-
Continue the conversation or manual adjustments to your report.
Helpful tips
Examples to Guide You
-
Platform-Specific: "Can you show me the performance metrics for the Pinterest platform?"
-
Focused Data: "I'm interested in data for the 'XYZ' campaign. What insights do you have?"
-
Broad Overview: "Give me a detailed analysis of all metrics for the last fiscal year."
Specifying Time Ranges:
-
From exact periods like "from January 2023 to June 2023" to general ones such as “Q1 of 2022”, Alli's got you covered.
-
Not in the mood for specifics and want all time data? Skip the timeframe!
Limit the data returned:
-
Alli's default? a maximum of 10,000 rows.
-
Customize this with terms like "show top 10" or "bottom 50".
Ordering and Filtering:
-
Want your data a certain way? Use terms like "highest revenue" or "lowest clicks".
-
Spotlight your data with filters such as platform names or account IDs. e.g. :
-
“specifically for the Twitter platform”.
-
“only for account XYZ”
-
Related articles
- How-To: Use categorizations within your custom report
- How-to add a new datasource to an existing Data Studio dashboard
- Advanced Guide: Enabling Big Query for a Custom Alert
- How-To: Name Datasource Columns
- How-To: Enable Product Feed Reporting
- How-To: Include Custom DSP Cost in Display Reporting
- How-To: Add a new categorization
- Tutorial: Getting started with Explorer Reports
- How-To: Backfill a datasource
- How-To: Categorize CM360 Conversions
- How-To: Create a new datasource
- How-to Create a Sentiment Dashboard from FB Sentiment
- How-To: Identify Which Platforms and Report Types are Enabled for Reporting
- How-To: Enable Device and Demographic Reporting
- How-To: Manually upload data to an existing datasource