
Explorer Overview
Overview
Alli Data Explorer provides you and your team a way to explore all the data available within Alli. This data can be used to visualize, create custom reports, and set up Alerts.
Navigating To Data Explorer
To get started with Data Explorer in your Alli client, navigate to Reporting on the side navigation menu. Within the Alli Reporting application, navigate to Explorer on the sub-navigation menu. This page will provide a list of all the datasources available for your client. Here you can search for the data that you are interested in, explore the Alli Certified data that has been built for your client, and get started on your data exploration journey by leveraging Ask Alli.
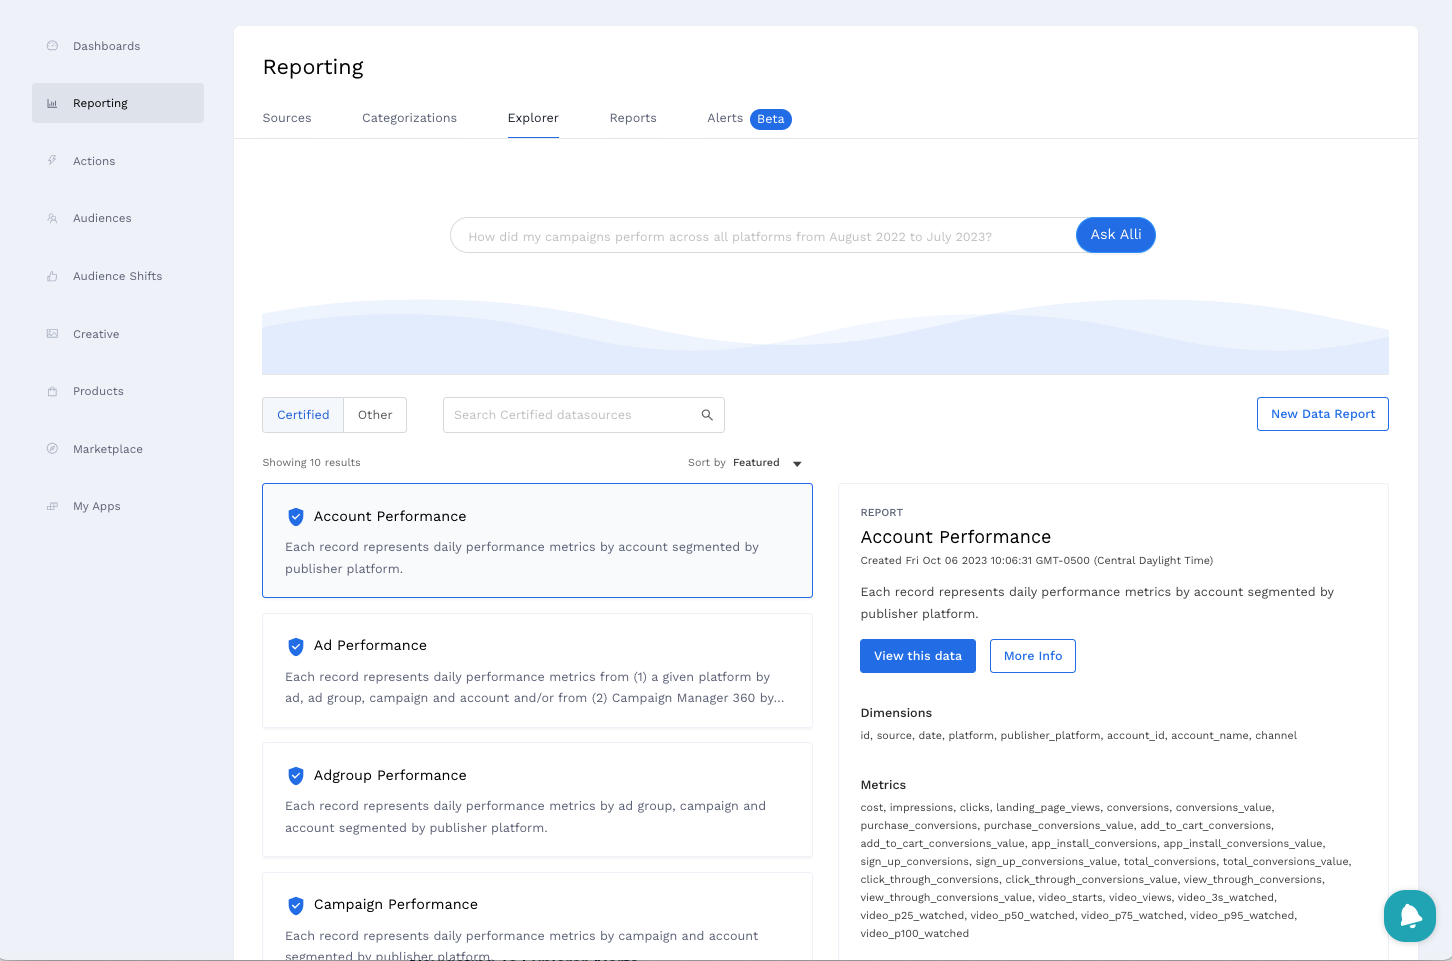
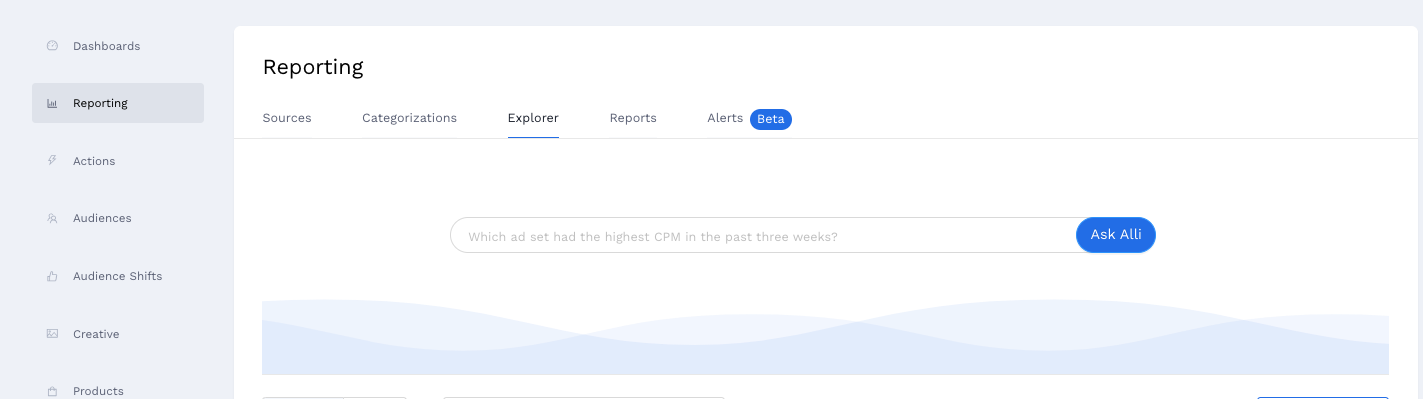
Ask Alli
Ask Alli utilizes advanced AI to process your natural language queries. No need to be a data expert—simply type your questions in plain English. Whether you're analyzing campaign performance, audience behavior, or budget pacing, Ask Alli provides instant visualizations, reporting tables, and SQL statements. Check out the how-to for an in-depth guide to using Ask Alli: How-to use Ask Alli
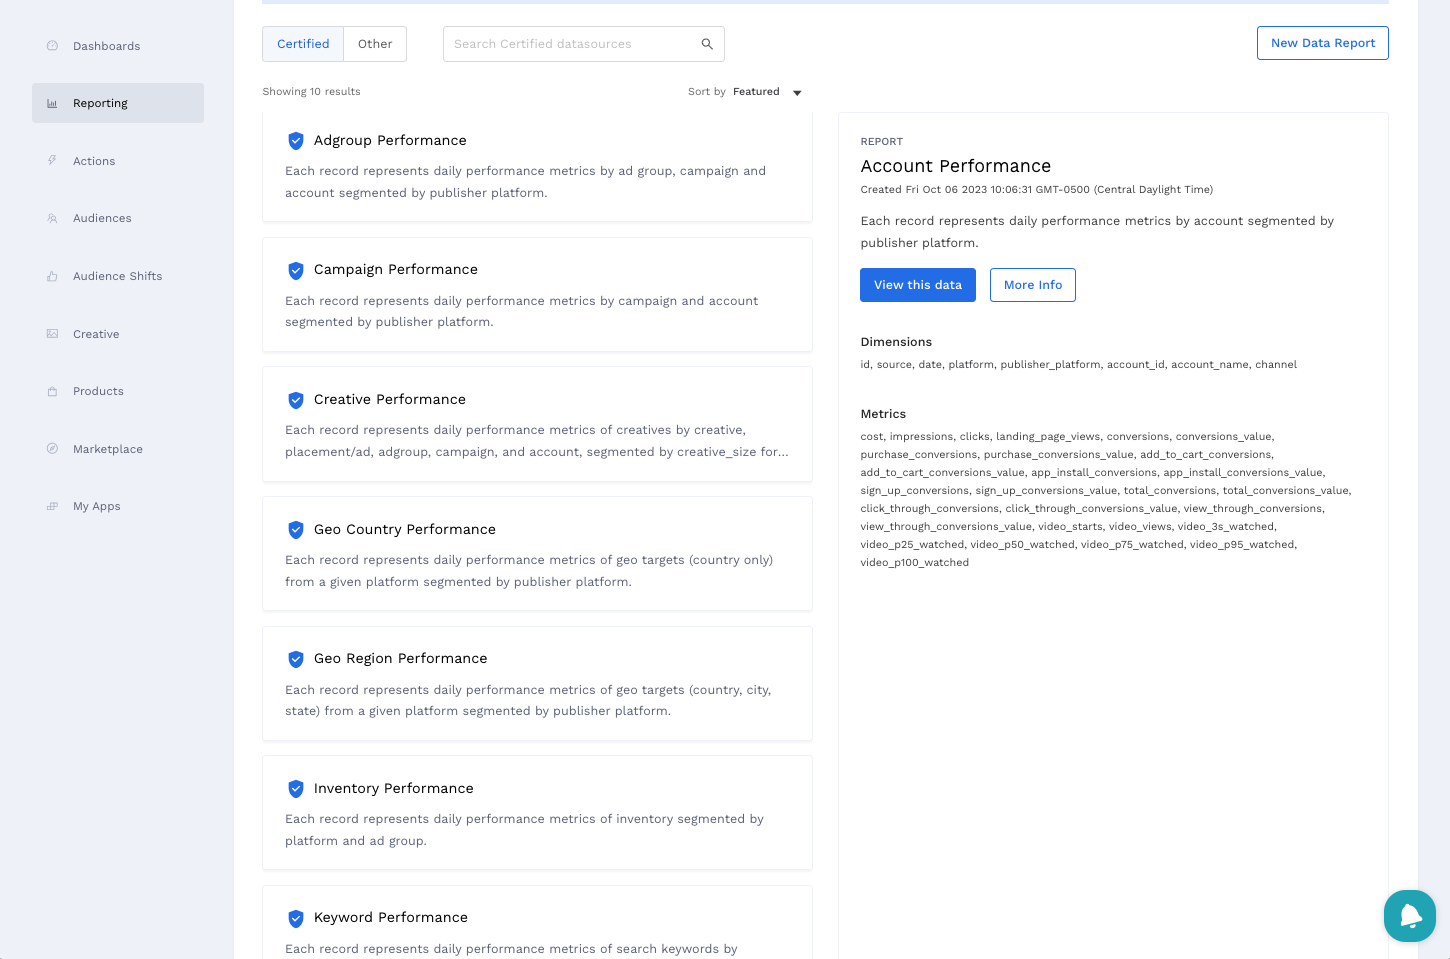
Alli Certified Datasources
Alli Certified Datasources provide clean, cross-channel data that can be leveraged for all your data exploration needs. Inclusive of multiple levels of data granularity, Alli Certified Datasources can be used to discover performance trends across campaigns, ads, geographies, or keywords. To locate these datasources, look out for the blue checkmark next to the datasource.
Data Lineage Visualization
To gather a deeper understanding of Alli Certified Datasources, click the More Info button and explore a detailed breakdown of the datasource’s available columns and a visualization of how the cross-channel data is blended together.
Easy-to-Understand Visuals: Think of it as a roadmap, showing how different data points come together. Our new visualization tool is like a flowchart, making it easy to understand how your data is connected.
Interactive Exploration: Click through different data layers and see the journey of how your blended data source was created. It’s intuitive and informative, especially if you're curious about the origins of your data.
Better Decisions, Faster: With cleaner, more reliable data and an easy way to build reporting from it, you're set up for quicker, more informed decision-making.
Alli Certified Datasources are powered by Alli Data Library, check out the dedicated documentation for a full overview: Alli Data Library 2.0
Exploring Your Data
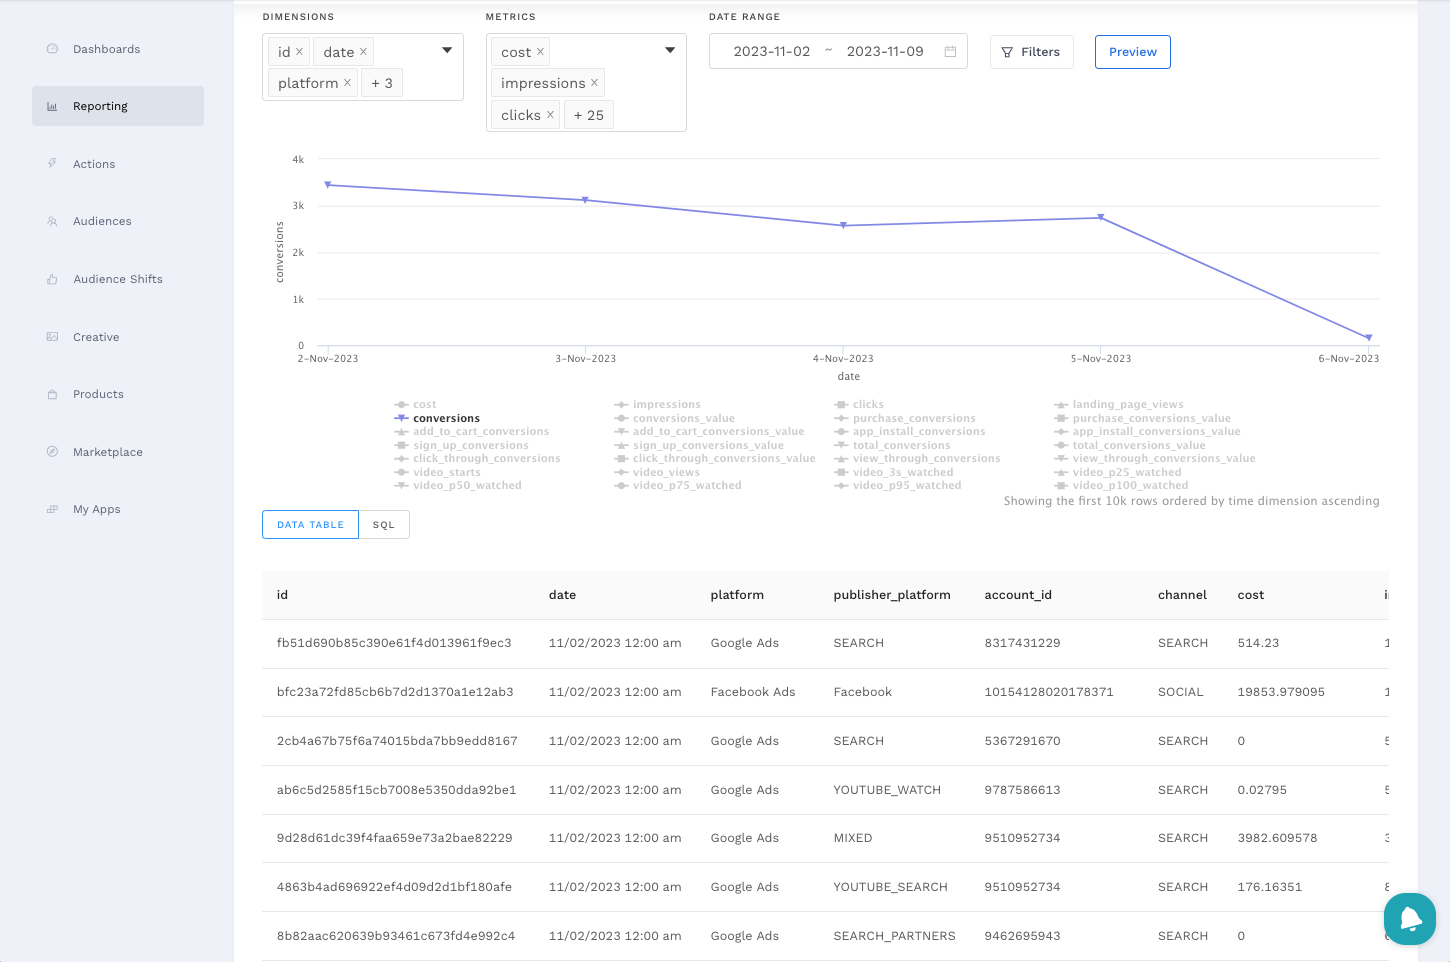
To begin gathering insights on your data, click the View this data button. This will land you on the report builder page where you can select the columns you are interested in, define a date range, and apply any filters you want. From there, click the Preview button to generate a graph and data table. Check out the how-to for an in-depth guide to creating reports: Getting started with Explorer Reports
Alerting From Your Data
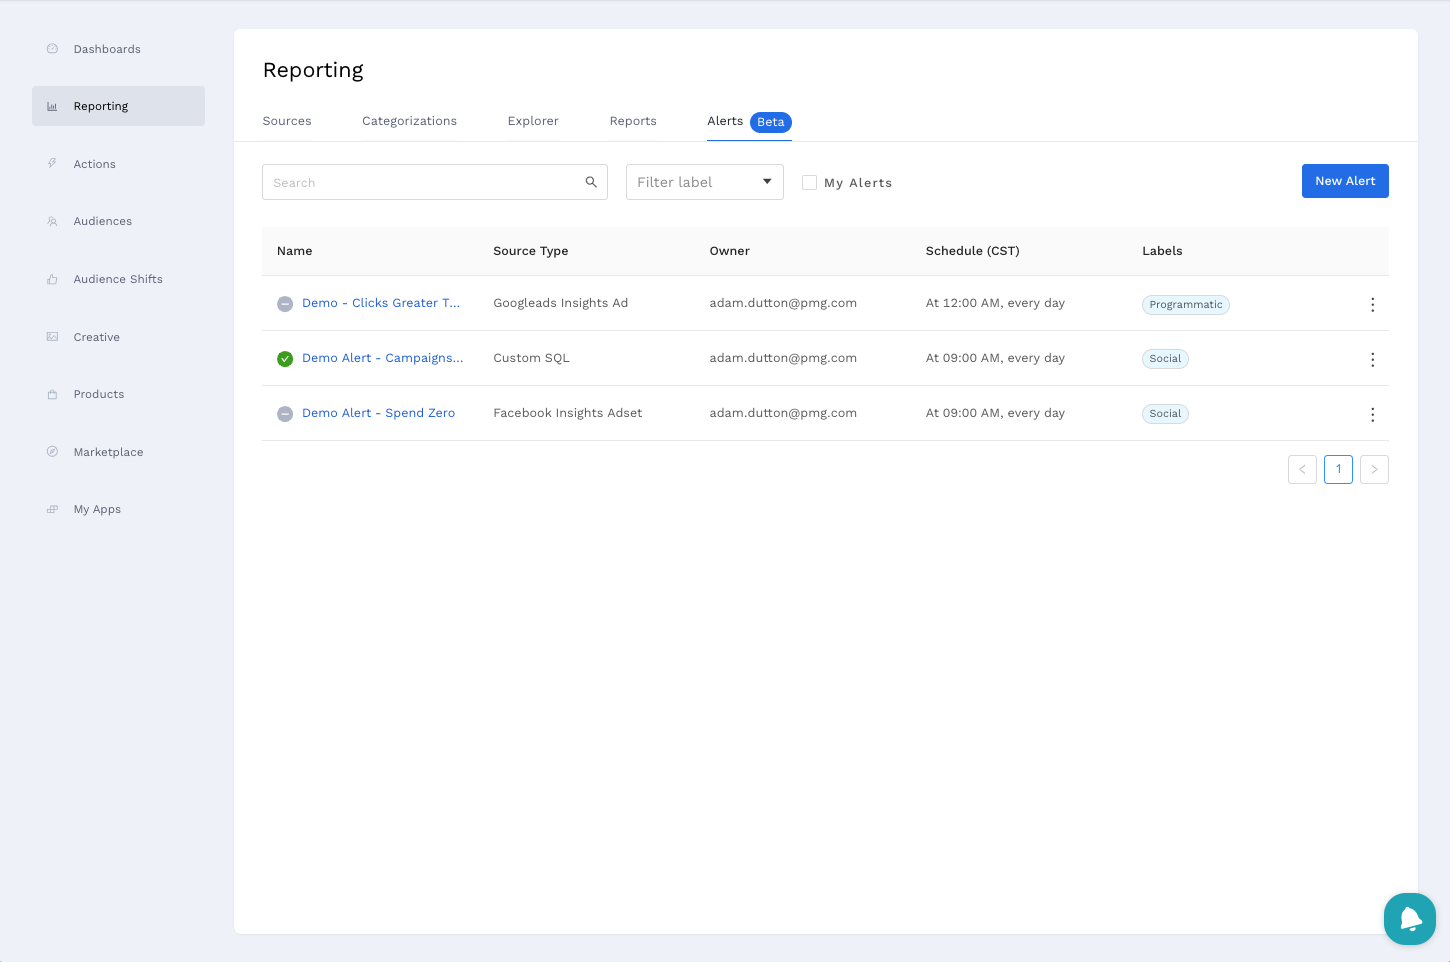
To begin receiving alerts via Slack or Email based on your data trends, navigate to Alerts on the sub-navigation menu. Here you can see existing alerts created for your client and create a new alert by clicking the New Alert button. Check out the how-to for an in-depth guide to creating alerts: Getting started with Explorer Alerts
For further training, check out the module below:
Alli Overview + Intro to Alli Data: 🔗 https://rise.articulate.com/share/JHEODFBTkxUSGqNO8SauOKj2O0yr3wqf 🔗
Password: PMG+Alli2023
Frequently Asked Questions
I created a datasource and I want to build a Report from it, how do I find that on the Explore page?
By default, Explorer shows you the Certified Datasourcs available for your client. To locate a datasource you created, toggle the list from Certified to Other and search for the datasource you created by name.
How can I get more Certified Datasources available for me in Explorer?
Currently, Certified Datasources are generated by PMG Data teams to ensure quality data. If you would like another slice to be included as a Certified Datasources, submit a support desk ticket and include information on what you would like to have available.