
How-to use Ask Alli
Overview
Ask Alli is your intuitive tool to effortlessly create insightful reports. Ask conversational questions, and let Alli deliver answers with the data you need.
Instructions
Getting Started with Ask Alli
To begin:
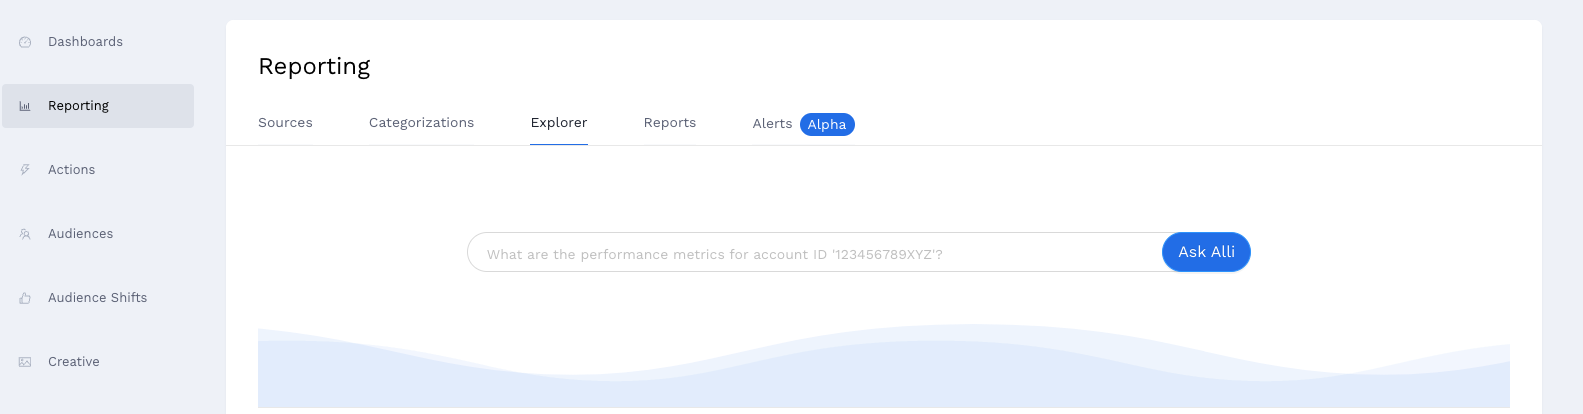
Navigate to the Data Explorer landing page.
From the Alli landing page: Head to Reporting followed by Explorer.
You'll see an input field. This is where the magic happens!
Examples to Guide You
Platform-Specific: "Can you show me the performance metrics for the Pinterest platform?"
Focused Data: "I'm interested in data for the 'XYZ' campaign. What insights do you have?"
Broad Overview: "Give me a detailed analysis of all metrics for the last fiscal year."
Helpful tips
Specifying Time Ranges:
From exact periods like "from January 2023 to June 2023" to general ones such as “Q1 of 2022”, Alli's got you covered.
Not in the mood for specifics and want all time data? Skip the timeframe!
Limit the data returned:
Alli's default? a maximum of 10,000 rows.
Customize this with terms like "show top 10" or "bottom 50".
Ordering and Filtering:
Want your data a certain way? Use terms like "highest revenue" or "lowest clicks".
Spotlight your data with filters such as platform names or account IDs. e.g. :
“specifically for the Twitter platform”.
“only for account XYZ”
Available Operations:
Equals, Not Equals, Contains, Does Not Contain, Greater Than, Greater Than or Equal To, Less Than, and Less Than or Equal To
Related articles
- How to name Datasource Columns
- How to manually upload data to an existing datasource
- How to archive and unarchive data sources
- How to create a manual datasource without validations
- How to setup a datasource that requires custom data
- How to Create a new datasource
- How to update datasource dimensions and metrics
- How to create a Smartsheet Datasource
- How to add a manual upload datasource