
Getting started with Explorer Reports
Overview
Alli Explorer Reports provides you and your team a way to create custom slices of your data that is most important to your business. These slices of data can be used to gather insights, set up Alerts, power Actions, or export to Excel.
Before Getting Started
Prior to setting up a new Explorer Report, ensure that:
You have a datasource: How to Create a new datasource
Alli Certified Datasources are a great way to get started: Explorer Overview | Alli-Certified-Datasources
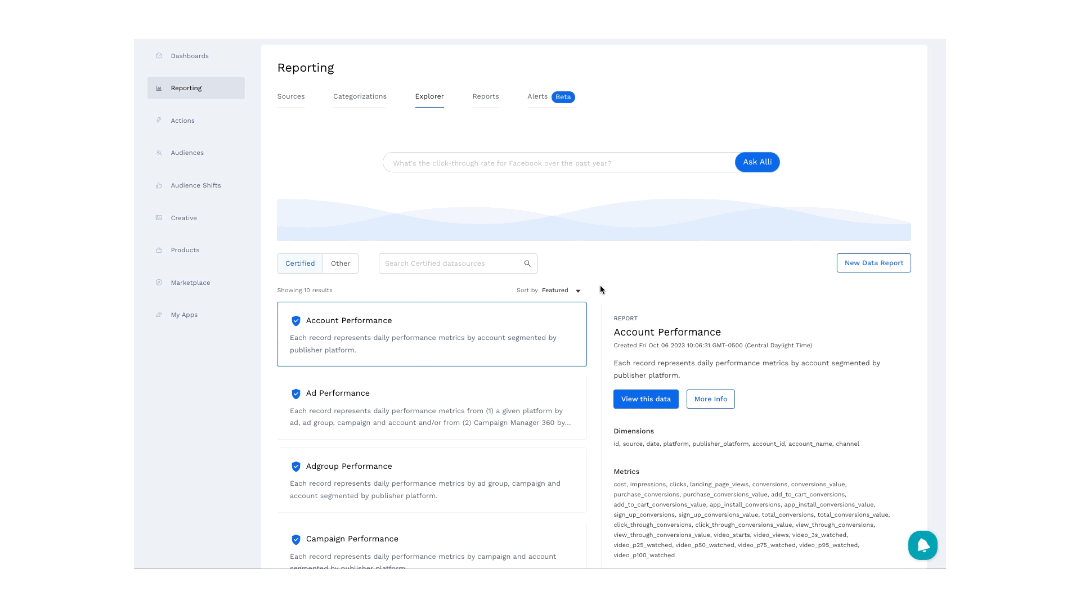
Navigating To Explorer Reports
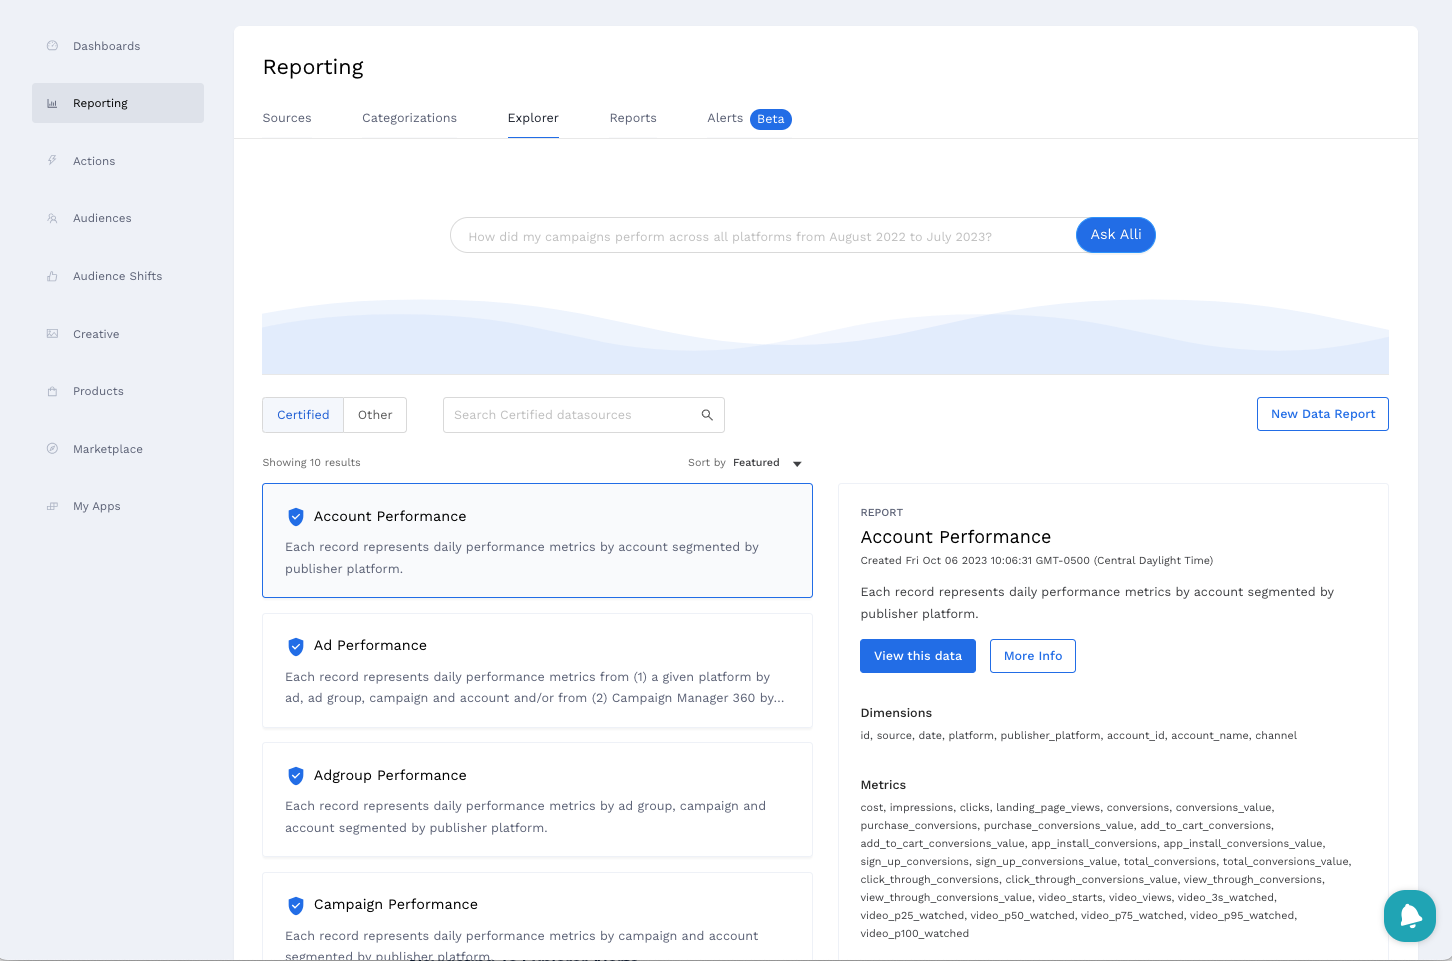
To get started with Explorer Reports within your Alli client, navigate to Reporting on the side navigation menu. Within the Alli Reporting application, navigate to Explorer on the sub-navigation menu. Here you can search for the data that you are interested in, explore the Alli Certified data that has been built for your client, and get started on your data exploration journey by leveraging Ask Alli.
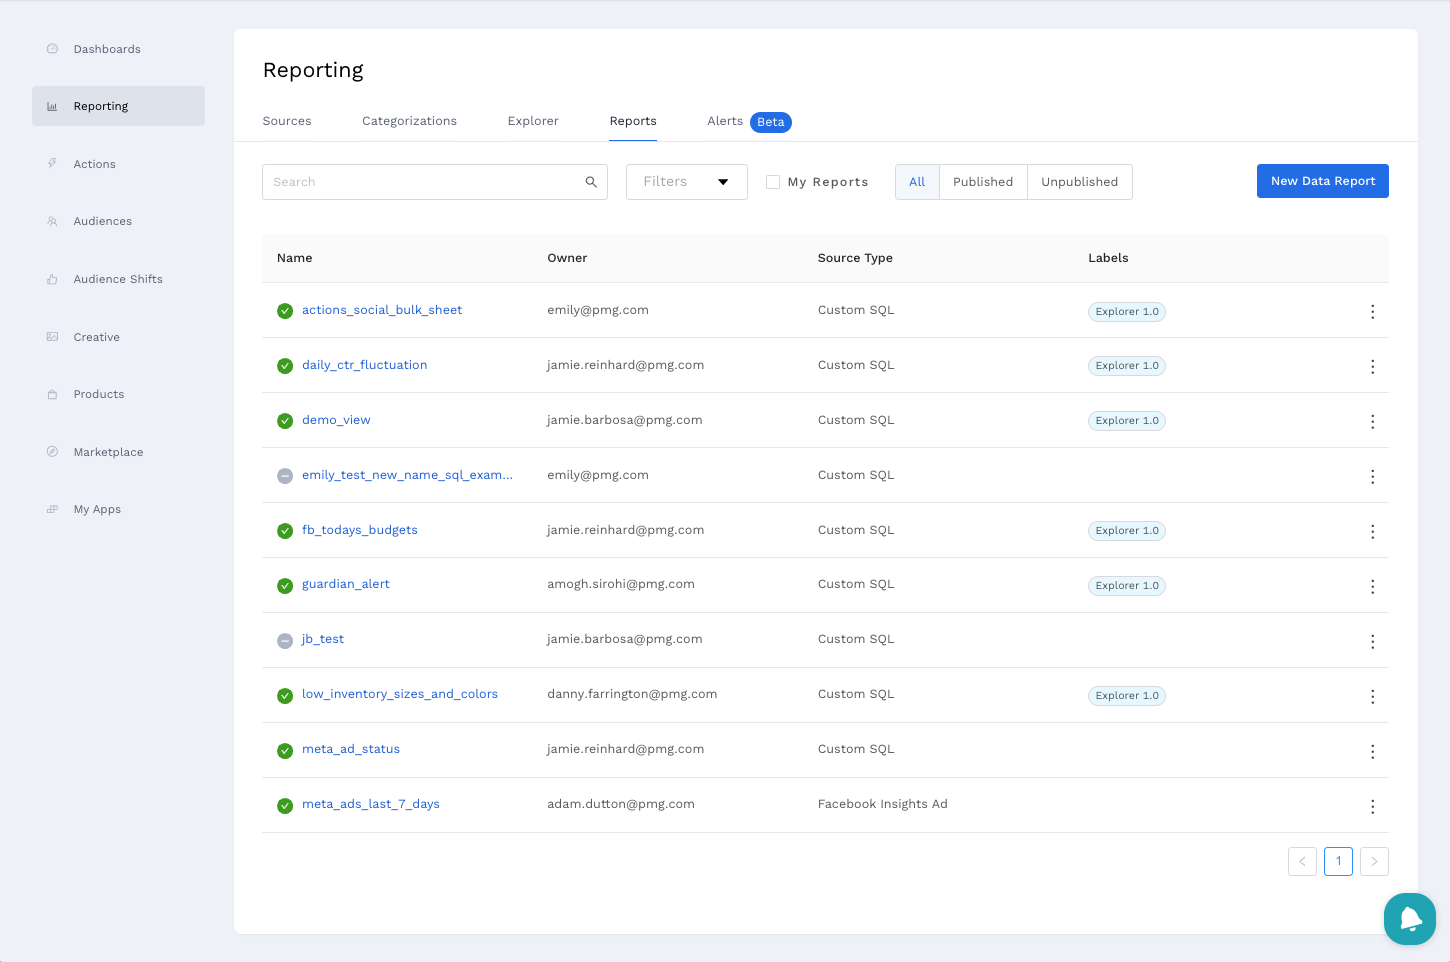
To locate an existing Explorer Report within your Alli client, navigate to Reporting on the side navigation menu. Within the Alli Reporting application, navigate to Reports on the sub-navigation menu. Here you can search or filter for existing Explorer Reports.
Create A New Explorer Report
Creating a new Explorer Report can be done one of two ways:
No-SQL Report Builder
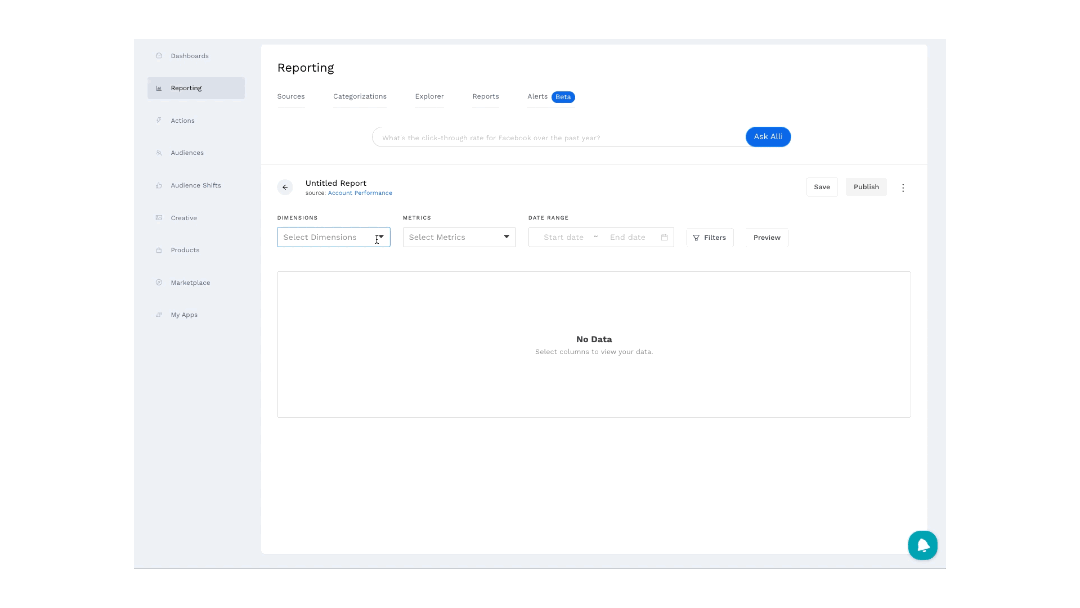
The first option is to leverage the No-SQL Report Builder. To navigate to the Report Builder page, click the View this data button or click New Data Report and select from an existing datasource.

Within the Report Builder page, you can select the Dimensions, Metrics, Date Range, and apply any Filters you want. When you are ready, click Preview to load the data. Once data is loaded, you can adjust the visualization, view the data table, and view the SQL being generated. When you’re satisfied with your report you can click Save to name report which allows you to come back to it later. If you would like to use the Report elsewhere in Alli, click Publish to make it available.
Advanced Date Range
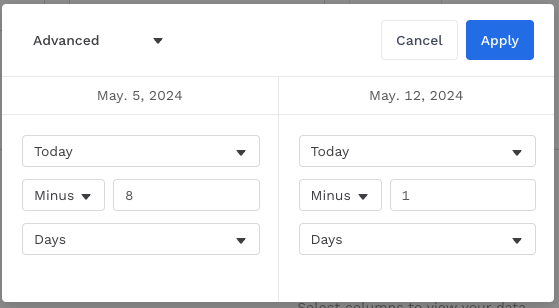
If you would like to build your report so that it leverages a “rolling” date range, you can leverage the Advanced date range feature. With this feature, you can set your start and end date to be dynamically generated. In the example below, you can see that I’ve set my start date to always look at the date that is 8 days prior to today and the end date to always look at the date that is 1 day prior to today. Fundamentally, this allows me to have a “rolling” 7 day window of data.
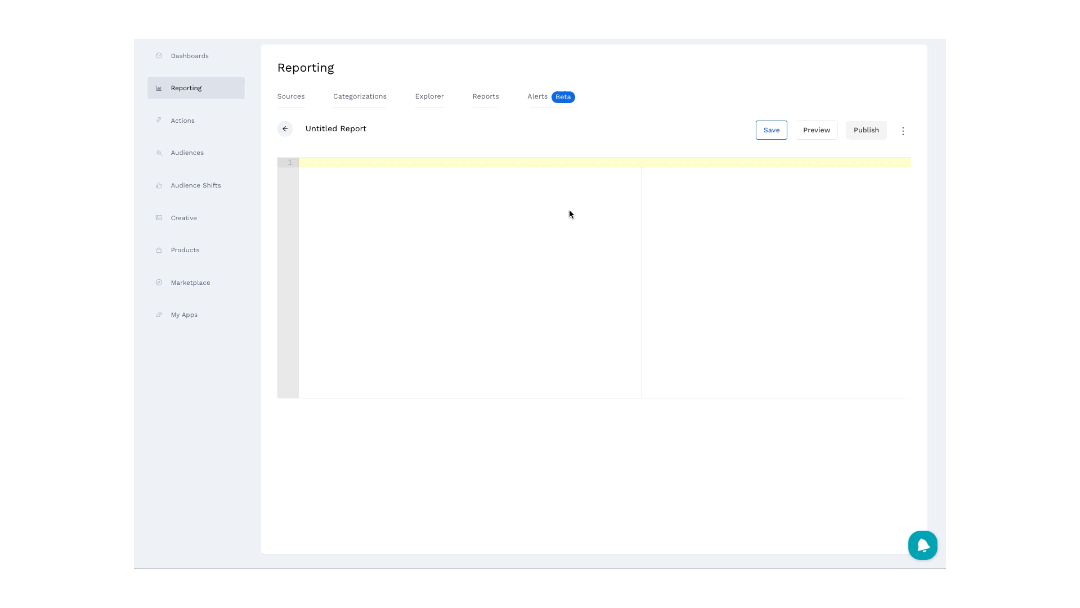
Custom SQL
The second option is to leverage Custom SQL which provides more flexibility in setting up your report. To navigate to the Custom SQL page, click New Data Report and select Custom SQL.
Within the SQL editor, add in your custom SQL referencing data from a datasource within your client. Be sure to include the client slug before the name of your datasource (ex. demo.facebook_insights_ad). When you are ready, click Preview to load the data. When you’re satisfied with your report you can click Save to name report which allows you to come back to it later. If you would like to use the Report elsewhere in Alli, click Publish to make it available.
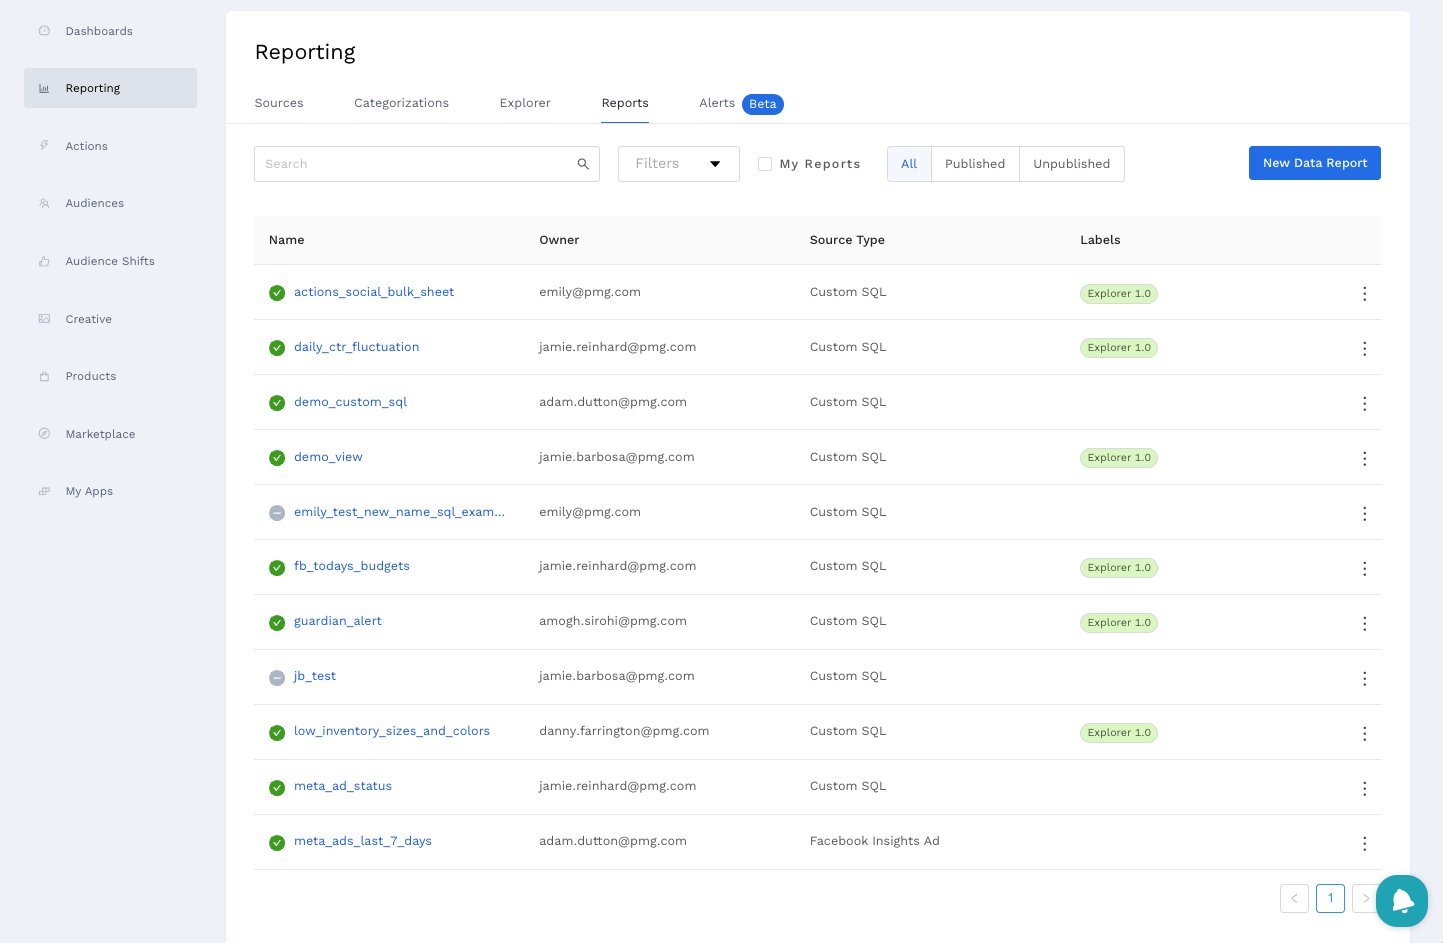
Find An Existing Report
If you’ve already created a report and would like to go back to it to make updates, navigate to Reports on the sub-navigation menu. This page will list all the Reports that have been set up for your client. Here you can search for existing Reports, filter existing Reports by Labels, and see the current status of a Report.
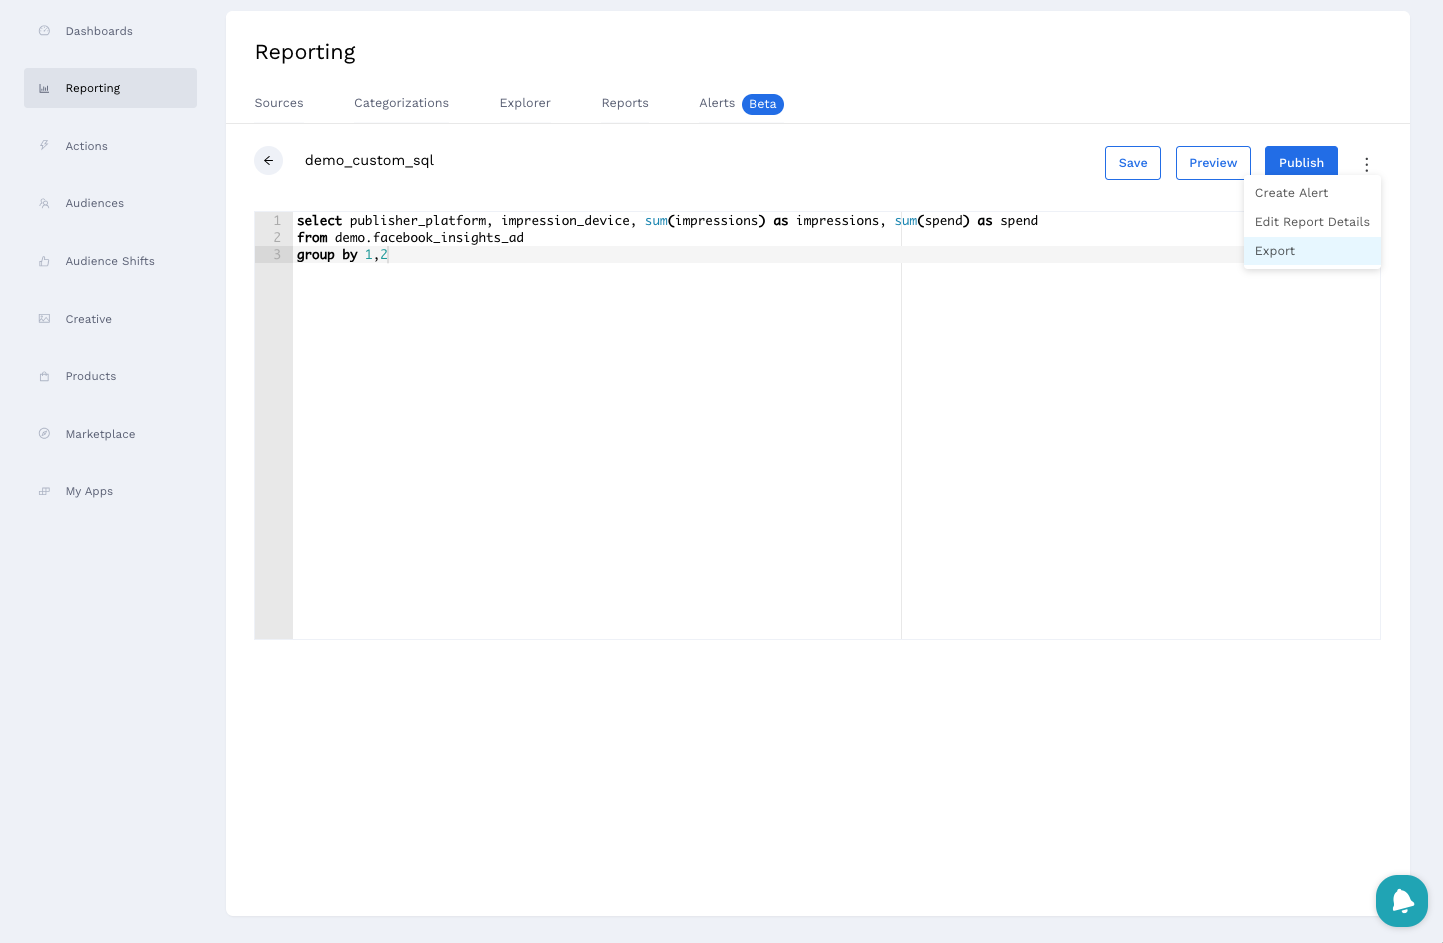
Exporting A Report
If you would like to export a Report’s data, first ensure your Report has been published. Then navigate to the three-dot menu within your Report and click Export. The file will be delivered to your email address once available.
Frequently Asked Questions
How many rows of data can I see within my Explorer Report results?
When previewing a report, there is a maximum row count of 10,000 that can be seen within the user interface. If exporting a report or referencing a report elsewhere within Alli, there is no row count limitation.
How can I add a calculated metric or column in Explorer?
Currently, the Report Builder only supports columns that exist within the underlying data however enabling calculated columns is currently in development and will be available soon.
Leveraging Custom SQL to create a report allows you to add any type of calculated column using standard SQL functions.
How can I merge multiple datasources together?
Currently, the Report Builder only allows you to build reports off a single datasource. However, leveraging Certified Datasources is a great way to build reports off data that has already been blended.
Leveraging Custom SQL to create a report allows you to merge any datasource together that is available for your client.
How can I use an Explorer Report to create a dashboard?
Currently, Reports created within Alli are not explicitly able to be used for dashboards. However, any datasource in Alli can be used in a dashboarding platform such as Looker Studio. Check out the in-depth guide for more information: How-to add a new datasource to an existing Data Studio dashboard