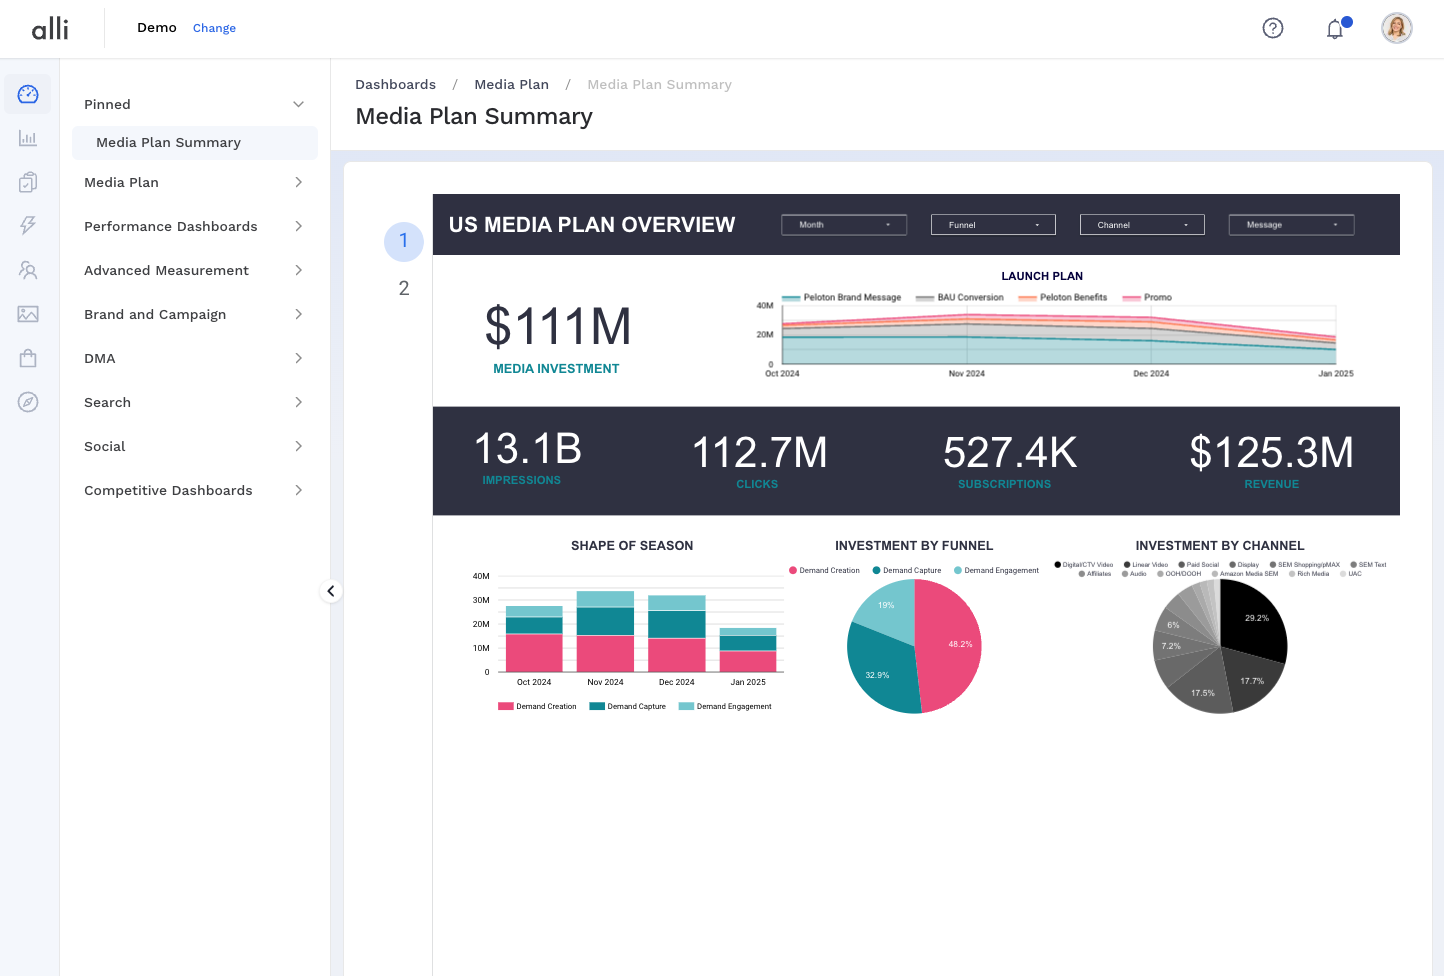
Your Gateway to Centralized Reporting
Alli’s dashboards are designed to transform complex data into actionable insights, empowering users to make informed decisions. These dashboards serve as a centralized platform for visualizing key metrics, tracking performance, and uncovering trends that matter to your goals.
With customizable features, Alli ensures that each dashboard aligns with specific needs, offering a tailored experience for every user. Whether you’re exploring pinned dashboards for quick access or diving into categorized sections, Alli’s dashboards provide the tools you need to stay ahead.

Key Benefits
-
Streamlined Organization: Consolidate various reporting tools into one central hub, making it easier to access and share information.
-
Customizable Visualizations: Create Dashboards at the client level, organizing visualizations according to your specific needs—whether for weekly updates or internal performance tracking.
-
Effortless Sharing: Use unique URLs for each visualization to ensure clients and teams can quickly access the right reports.
-
Enhanced Collaboration: Facilitate better communication between internal and external stakeholders by keeping everyone aligned on the latest data.
-
Permission Management: Leverage existing access controls within hosting services, removing the need for redundant permission setups.
A Flexible Approach to Reporting
Dashboards are designed with flexibility in mind. Whether you’re showcasing progress in a “Weekly Reports” Dashboard or maintaining operational insights in an “Internal Reports” Dashboard, the structure adapts to fit your workflow. Each visualization’s unique URL ensures clarity and consistency, eliminating the hassle of misplaced or outdated reports.