
Purpose
Generative Dashboards are powerful but new — and questions will come up. Support is designed to help you troubleshoot quickly, whether it’s a data issue or a visualization/editing issue.
1. General Support Help → help.alliplatform.com
Use this if you need guidance or troubleshooting that isn’t caused by a product defect.
Examples:
-
“How do I export my dashboard to Excel?”
-
“Where do I find filters in Generative Dashboards?”
-
“Can someone walk me through editing a chart in Code View?”
2. Bug Reports → help.alliplatform.com
Use this if something is broken or not working as intended.
Examples:
-
“My dashboard won’t save when I apply filters.”
-
“The data table export button isn’t downloading a file.”
-
“Charts disappear when I switch from bar to line.”
3. Feature Requests → ideas.alliplatform.com
Use this if you want to suggest an improvement or new capability.
Examples:
-
“Can we add a funnel chart type to Generative Dashboards?”
-
“I’d like to pin multiple dashboards in a folder for clients.”
Support Process
-
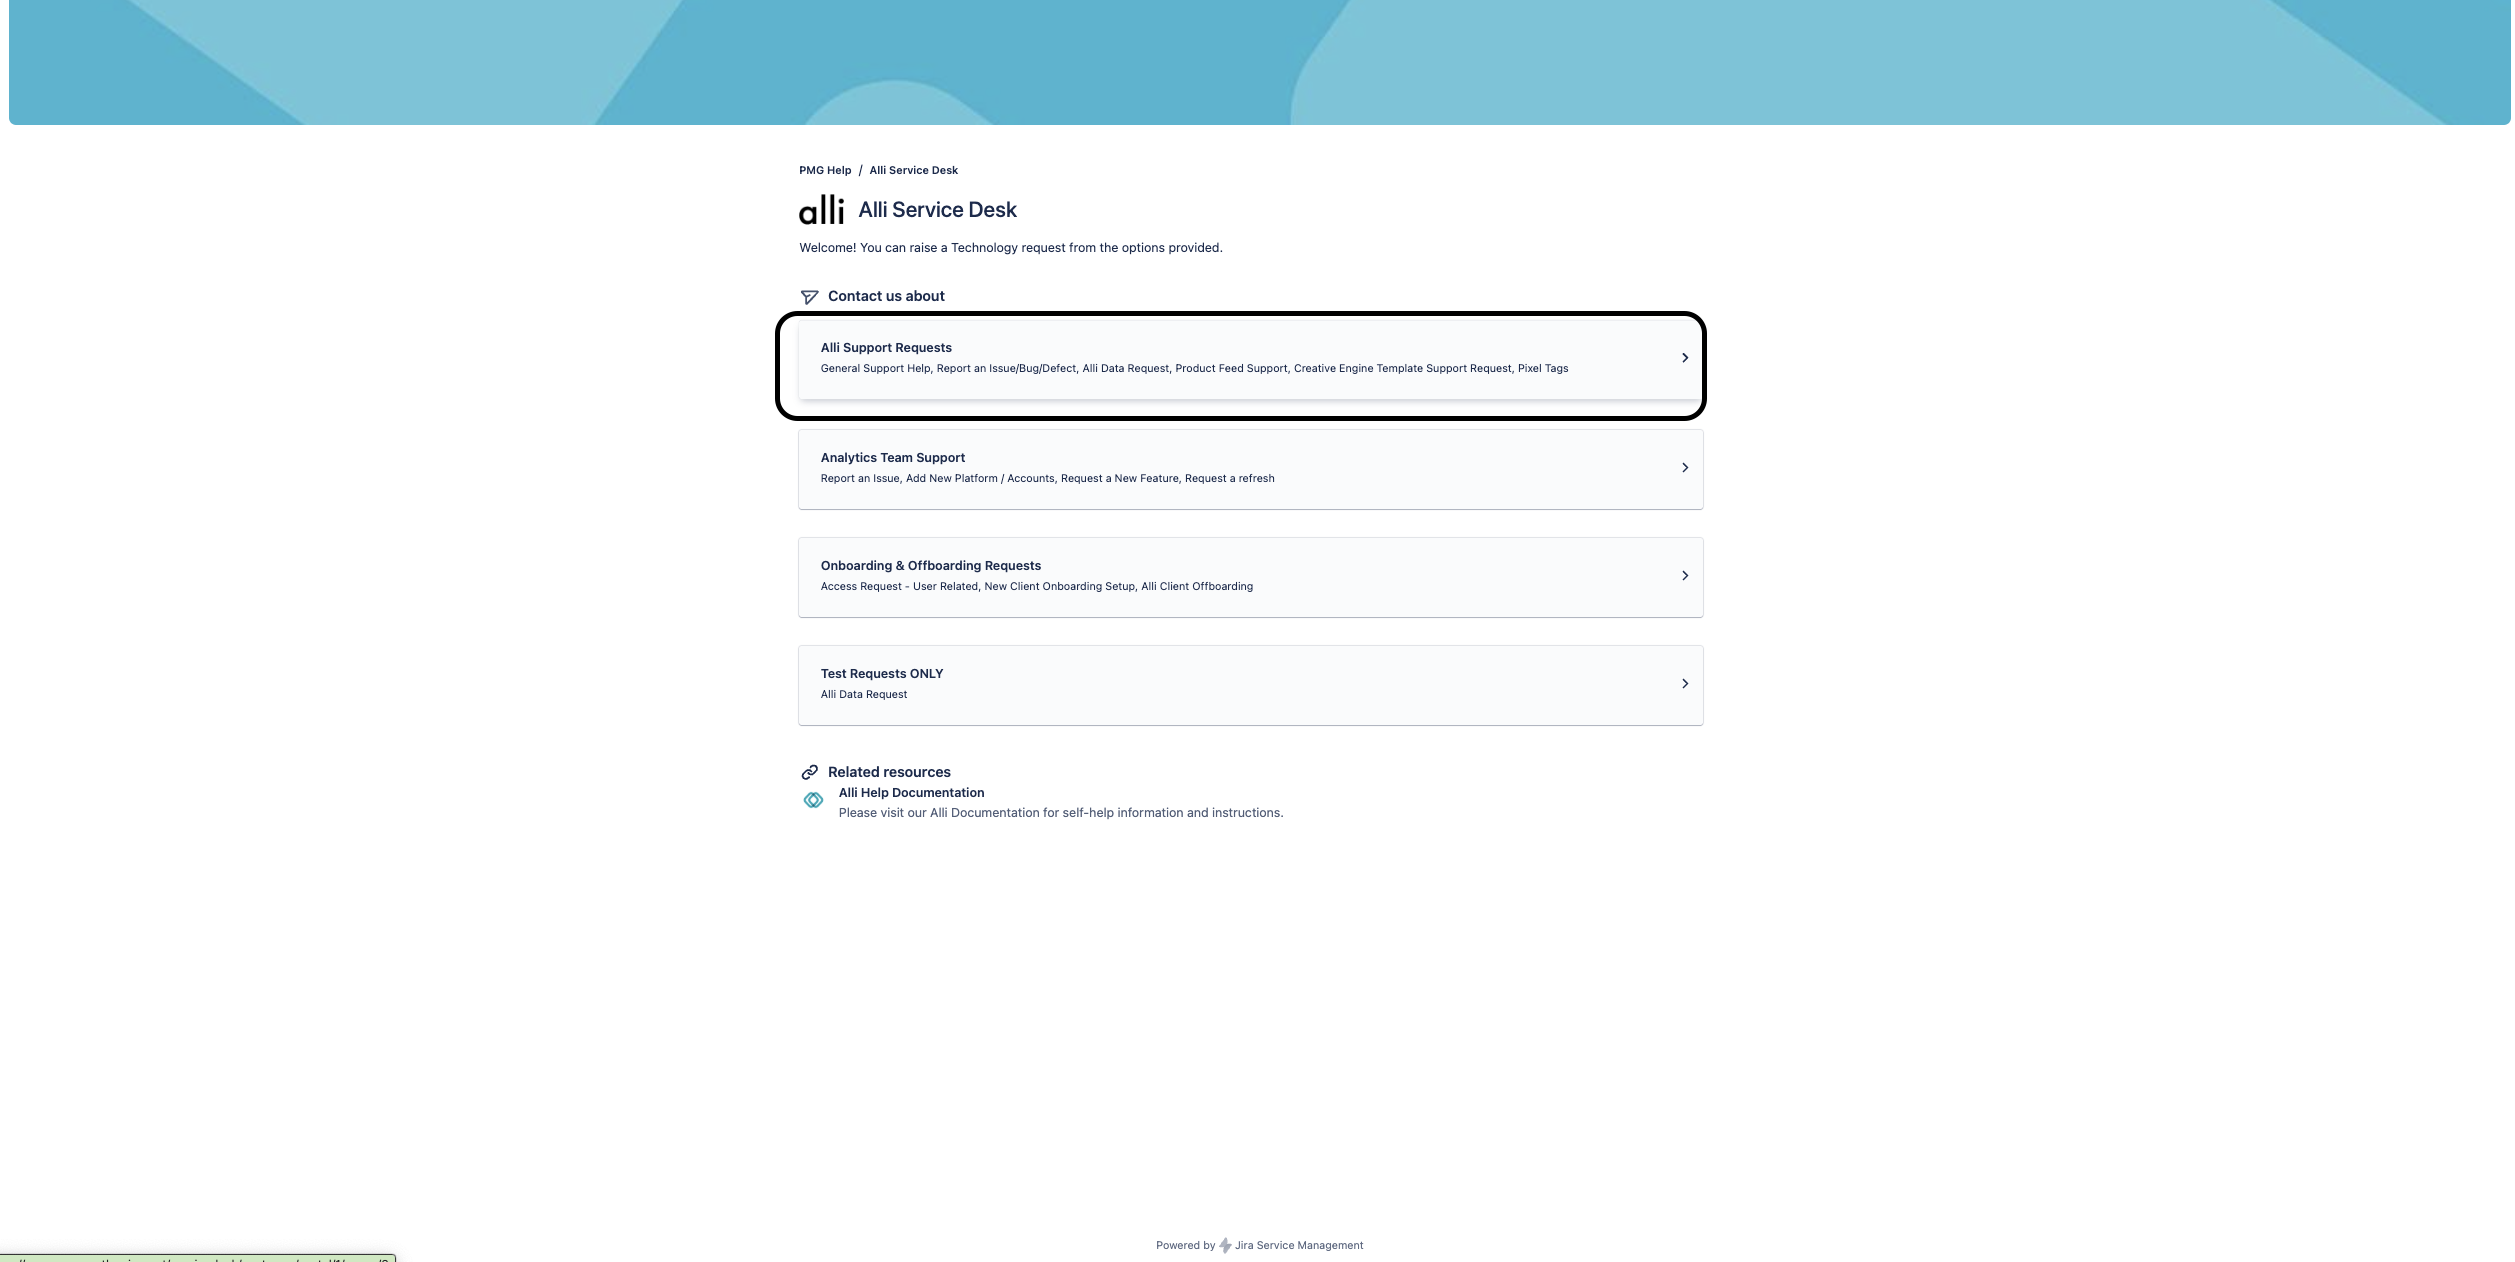
Go to help.alliplatform.com
-
Select Alli Service Desk or any other Service Desk like {client name} Service Desk if your client has a separate support portal
-
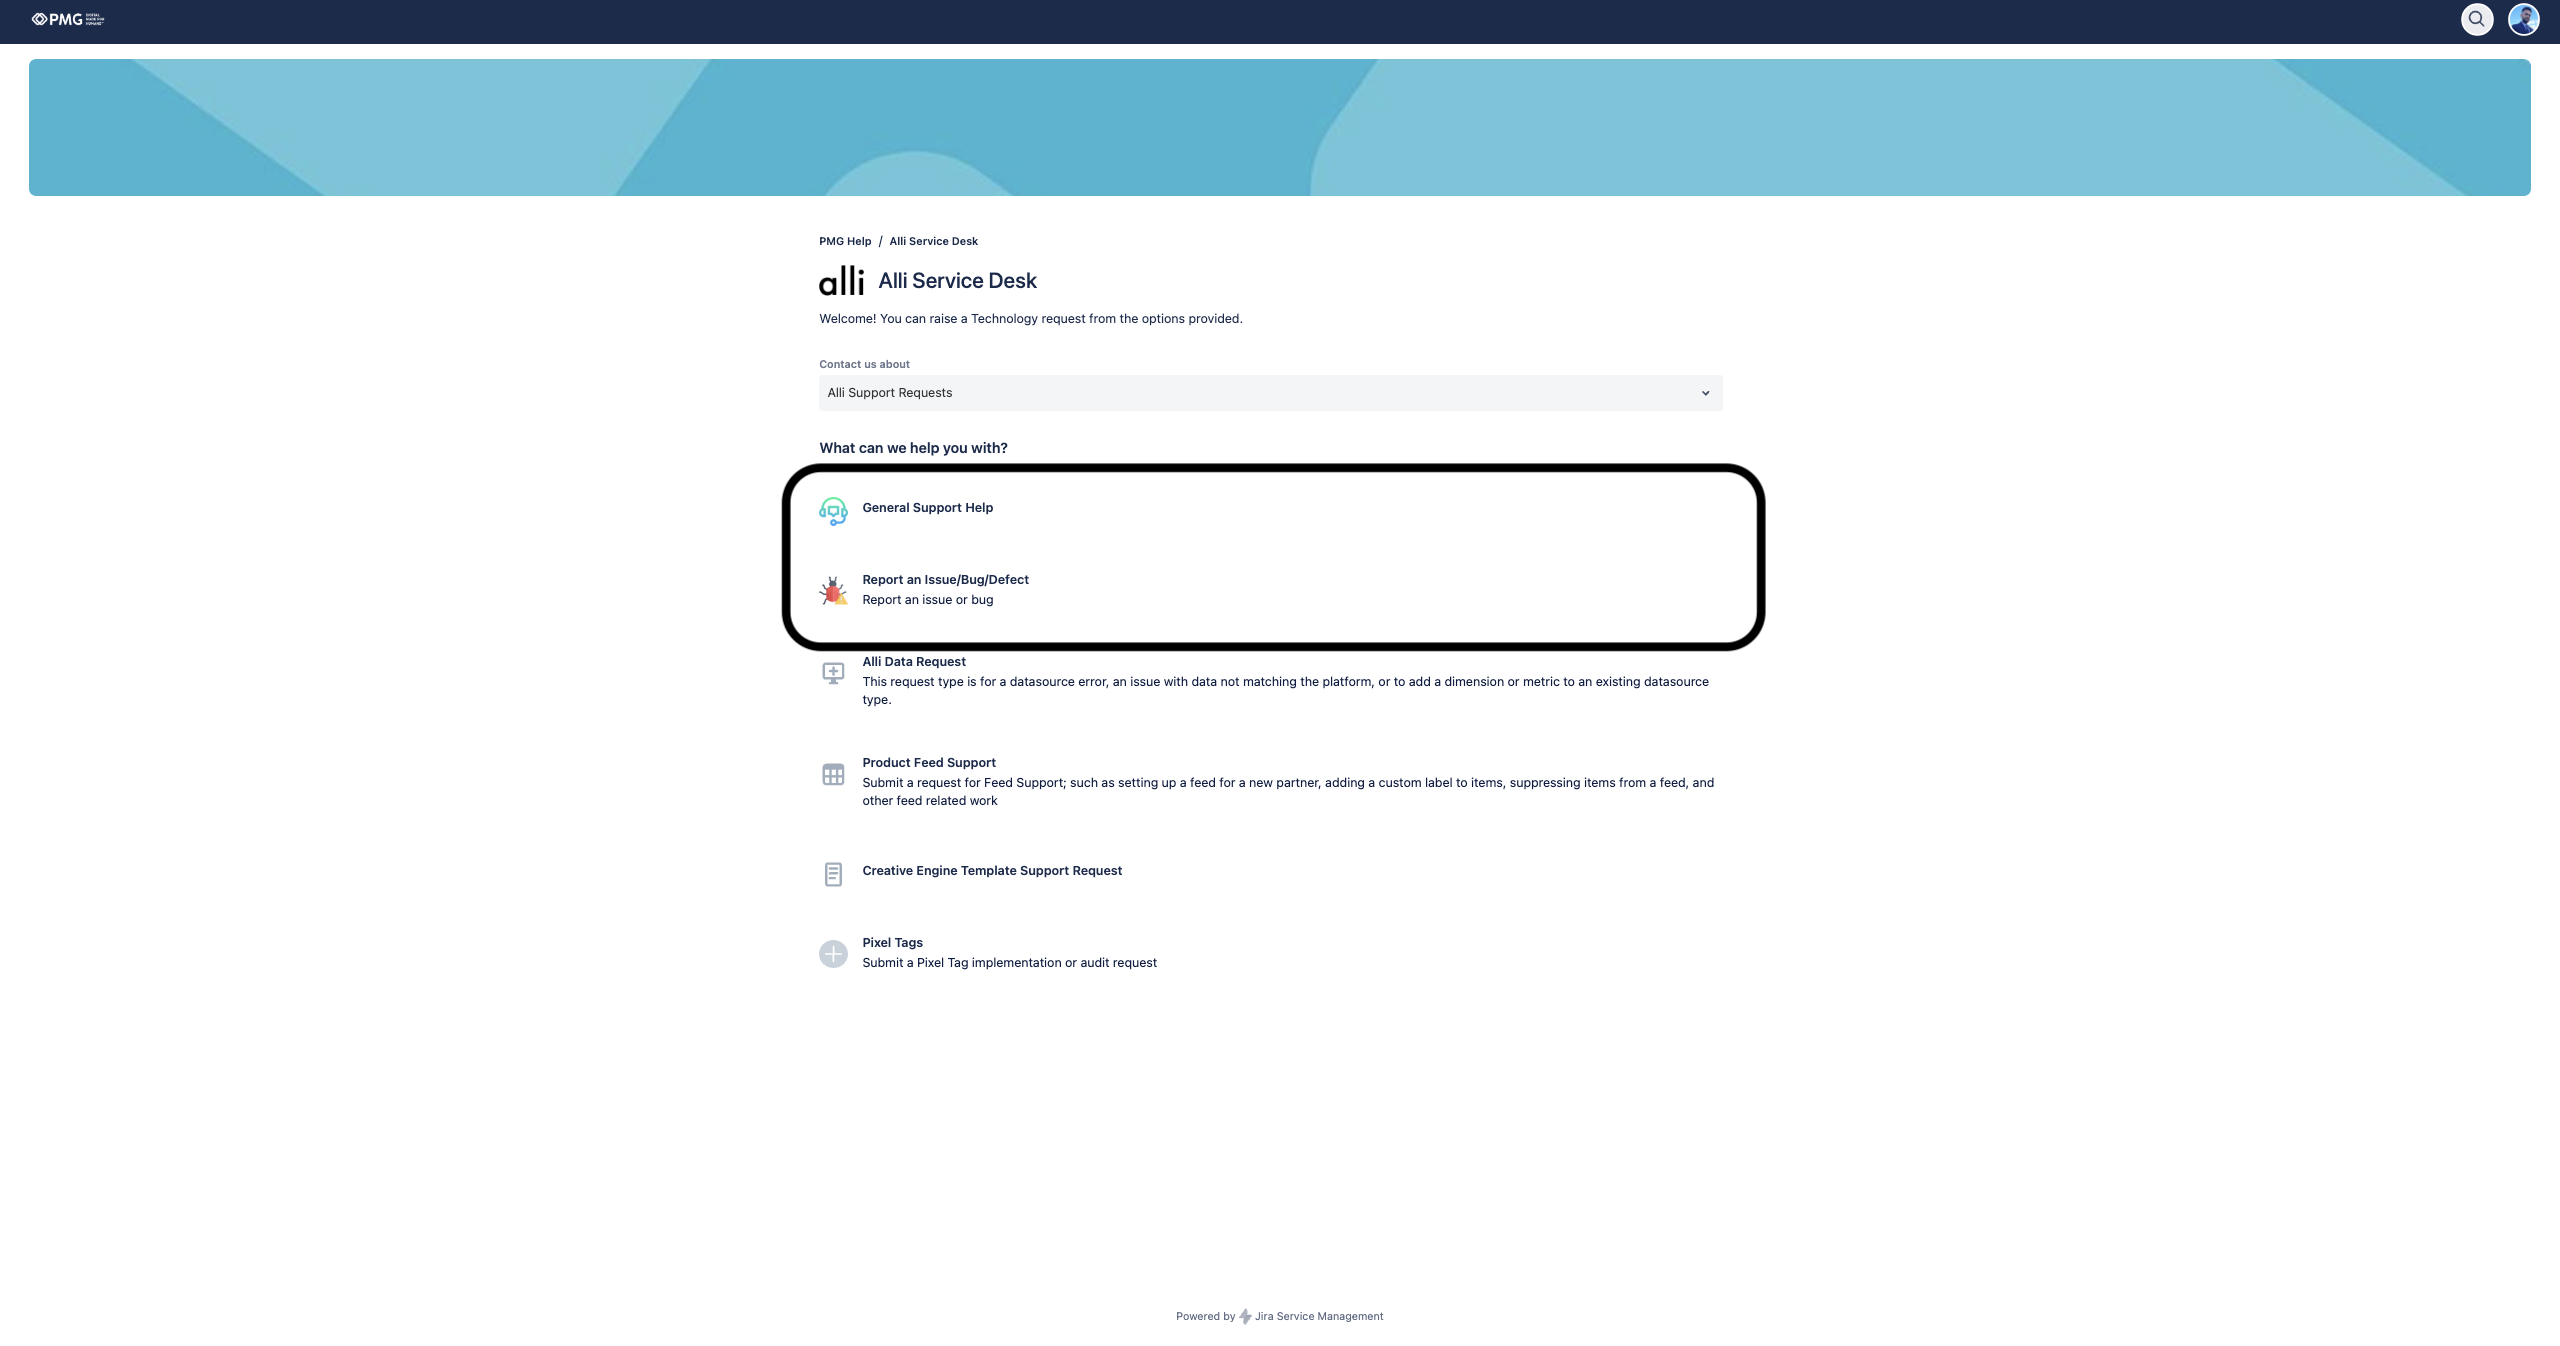
Select Alli Support Requests
-
Select General Support Help or Report a Bug, depending on your request
-
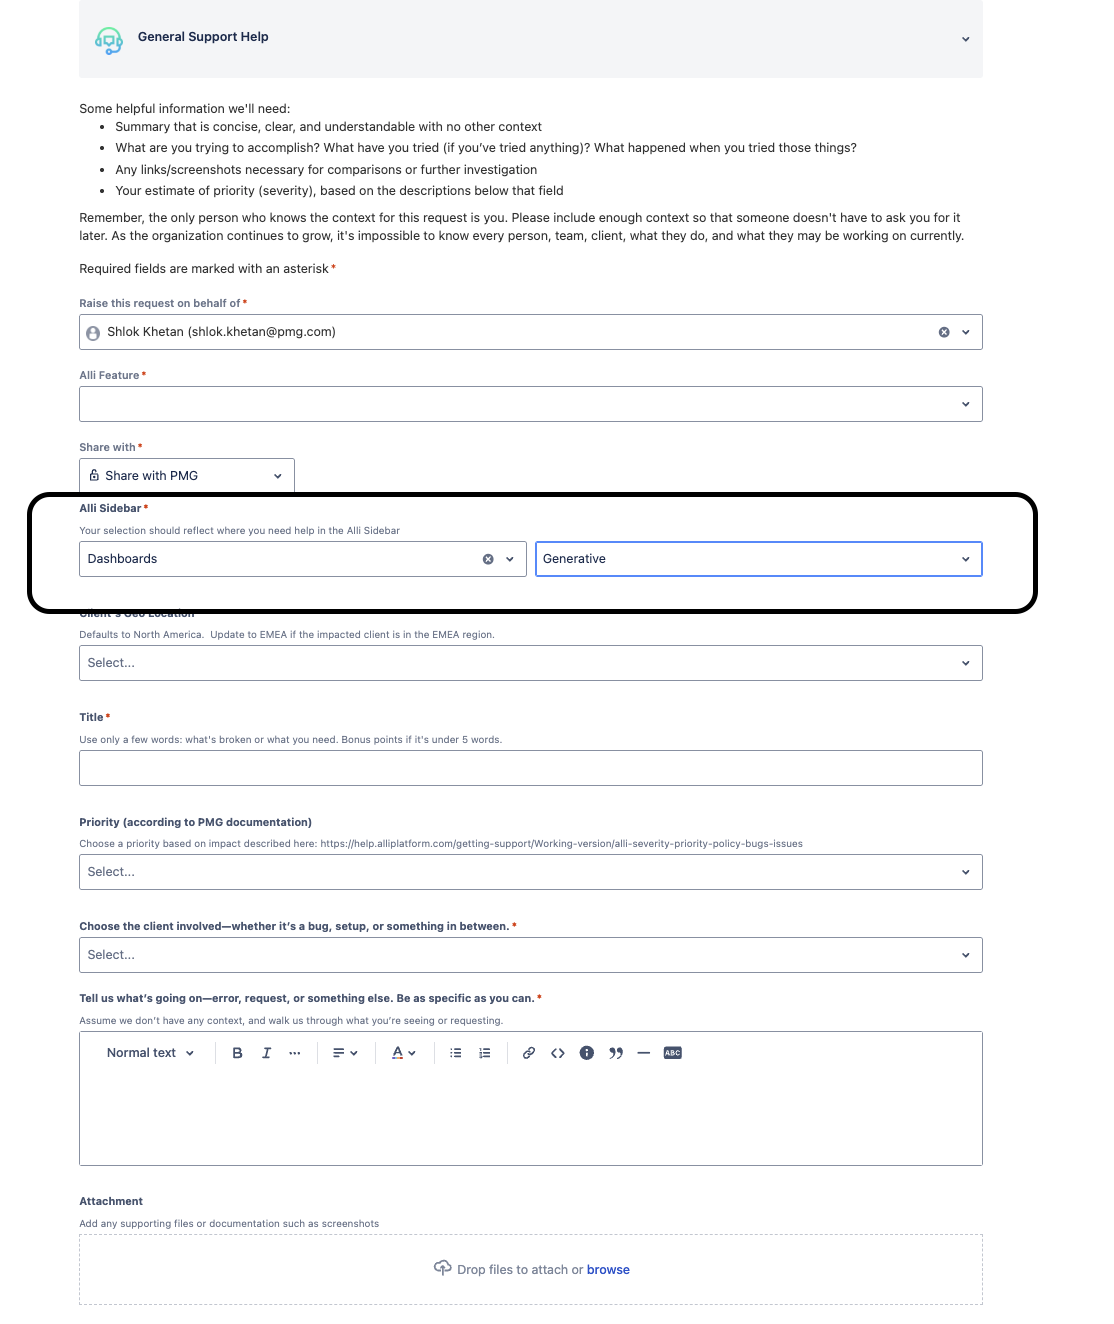
Fill out the required fields, and do not forget to include the link to the URL of the Dashboard and select Generative Dashboards
-
When you are done filling out the form, hit send and the alli team will get back to you ASAP!
Support Channels
-
Alli Assist Bar
-
Dedicated support window: 10:20–11:20 AM weekly every Tuesday.
-
Engineers will be available to troubleshoot Gen Dashboards issues.
-
You can bring your client analyst if your question relates to a specific client’s data.
-
-
Prompt Bar & AI Help
-
Use the prompt bar for quick fixes (e.g., “make this a line chart with ROAS on the y-axis”).
-
If you hit errors in Code View, paste the error into the prompt bar or an AI chatbot to get guidance.
-
-
Documentation & Examples
-
Refer to these “How To” docs for step-by-step guides.
-
Explore example code snippets for advanced edits.
-
Best Practices
-
Bring the right people: Analysts for data questions, engineers for chart/technical questions.
-
Use AI first: Many edits can be handled by rephrasing your prompt or pasting an error into AI.
-
Keep it reproducible: Be ready to share the dashboard, filters, and steps so support can replicate your issue.
-
Escalate smartly: If a visualization request is too complex or non-standard, it may require engineering review.