
Steps on how to convert any chart into a text box for users to put in their weekly insights in a dashboard or use it for any other purposes
Status: DRAFT · Product: Generative Dashboards (Alli) · Owner: @shlok.khetan
Option A — Prompt (fastest)
-
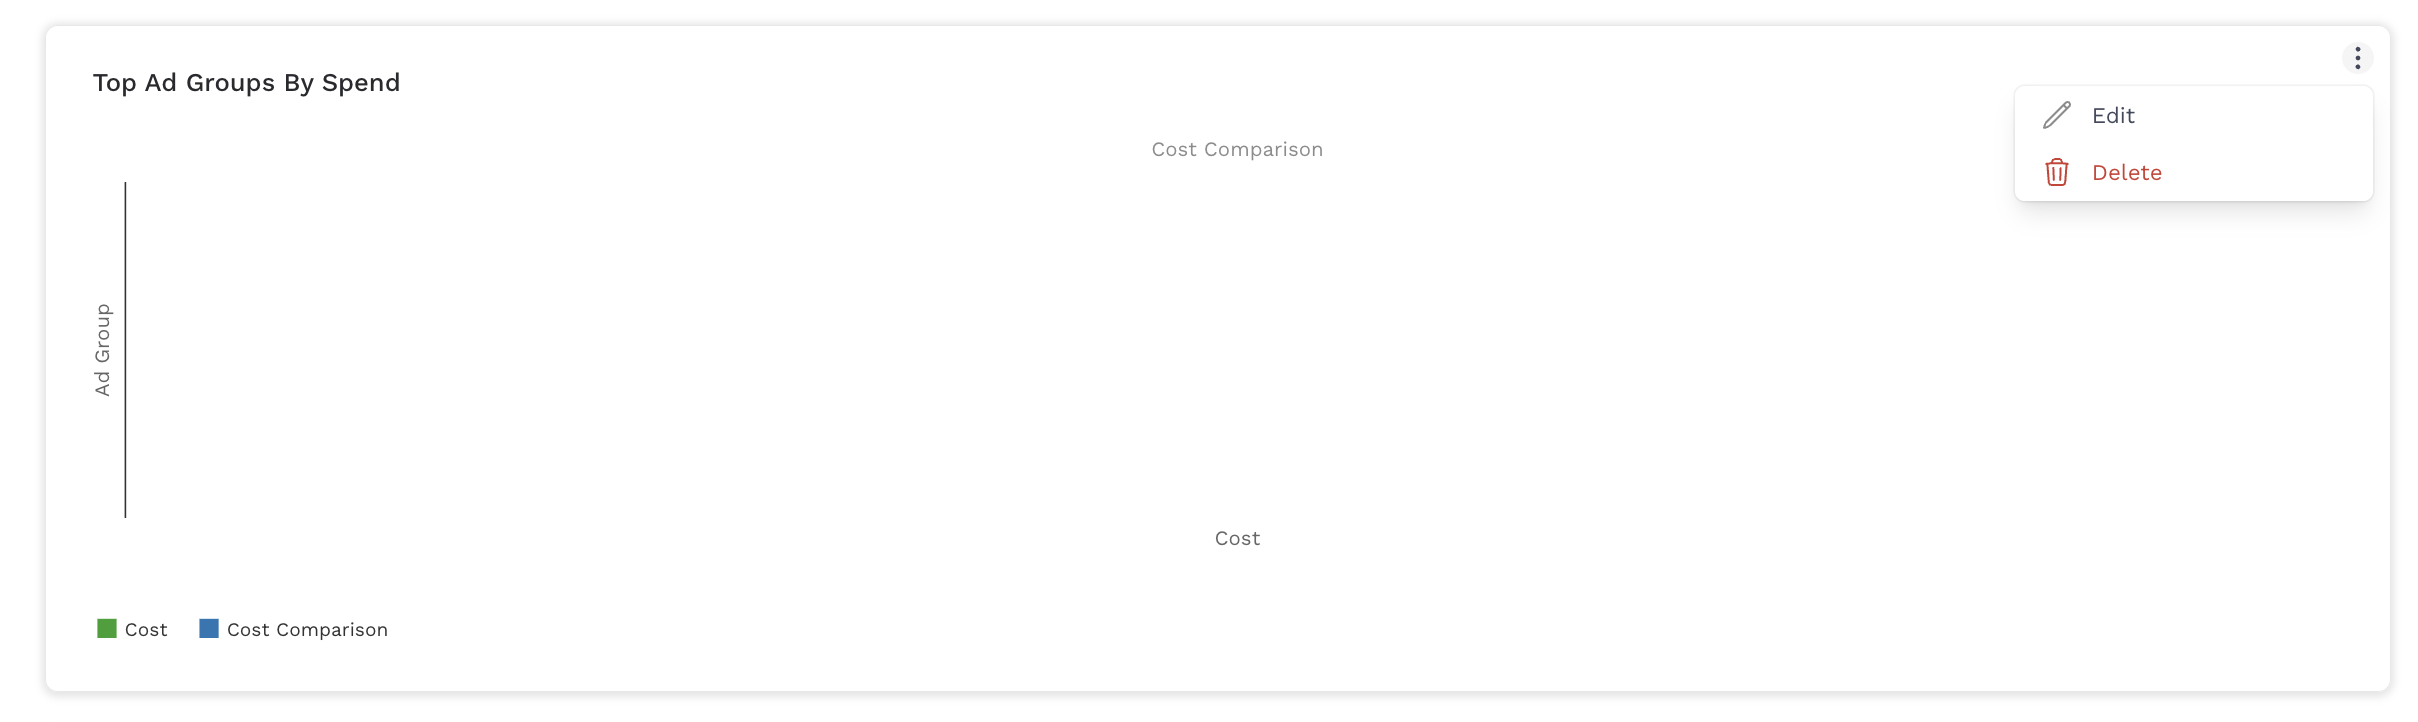
Click ⋯ on any card → Edit.
-
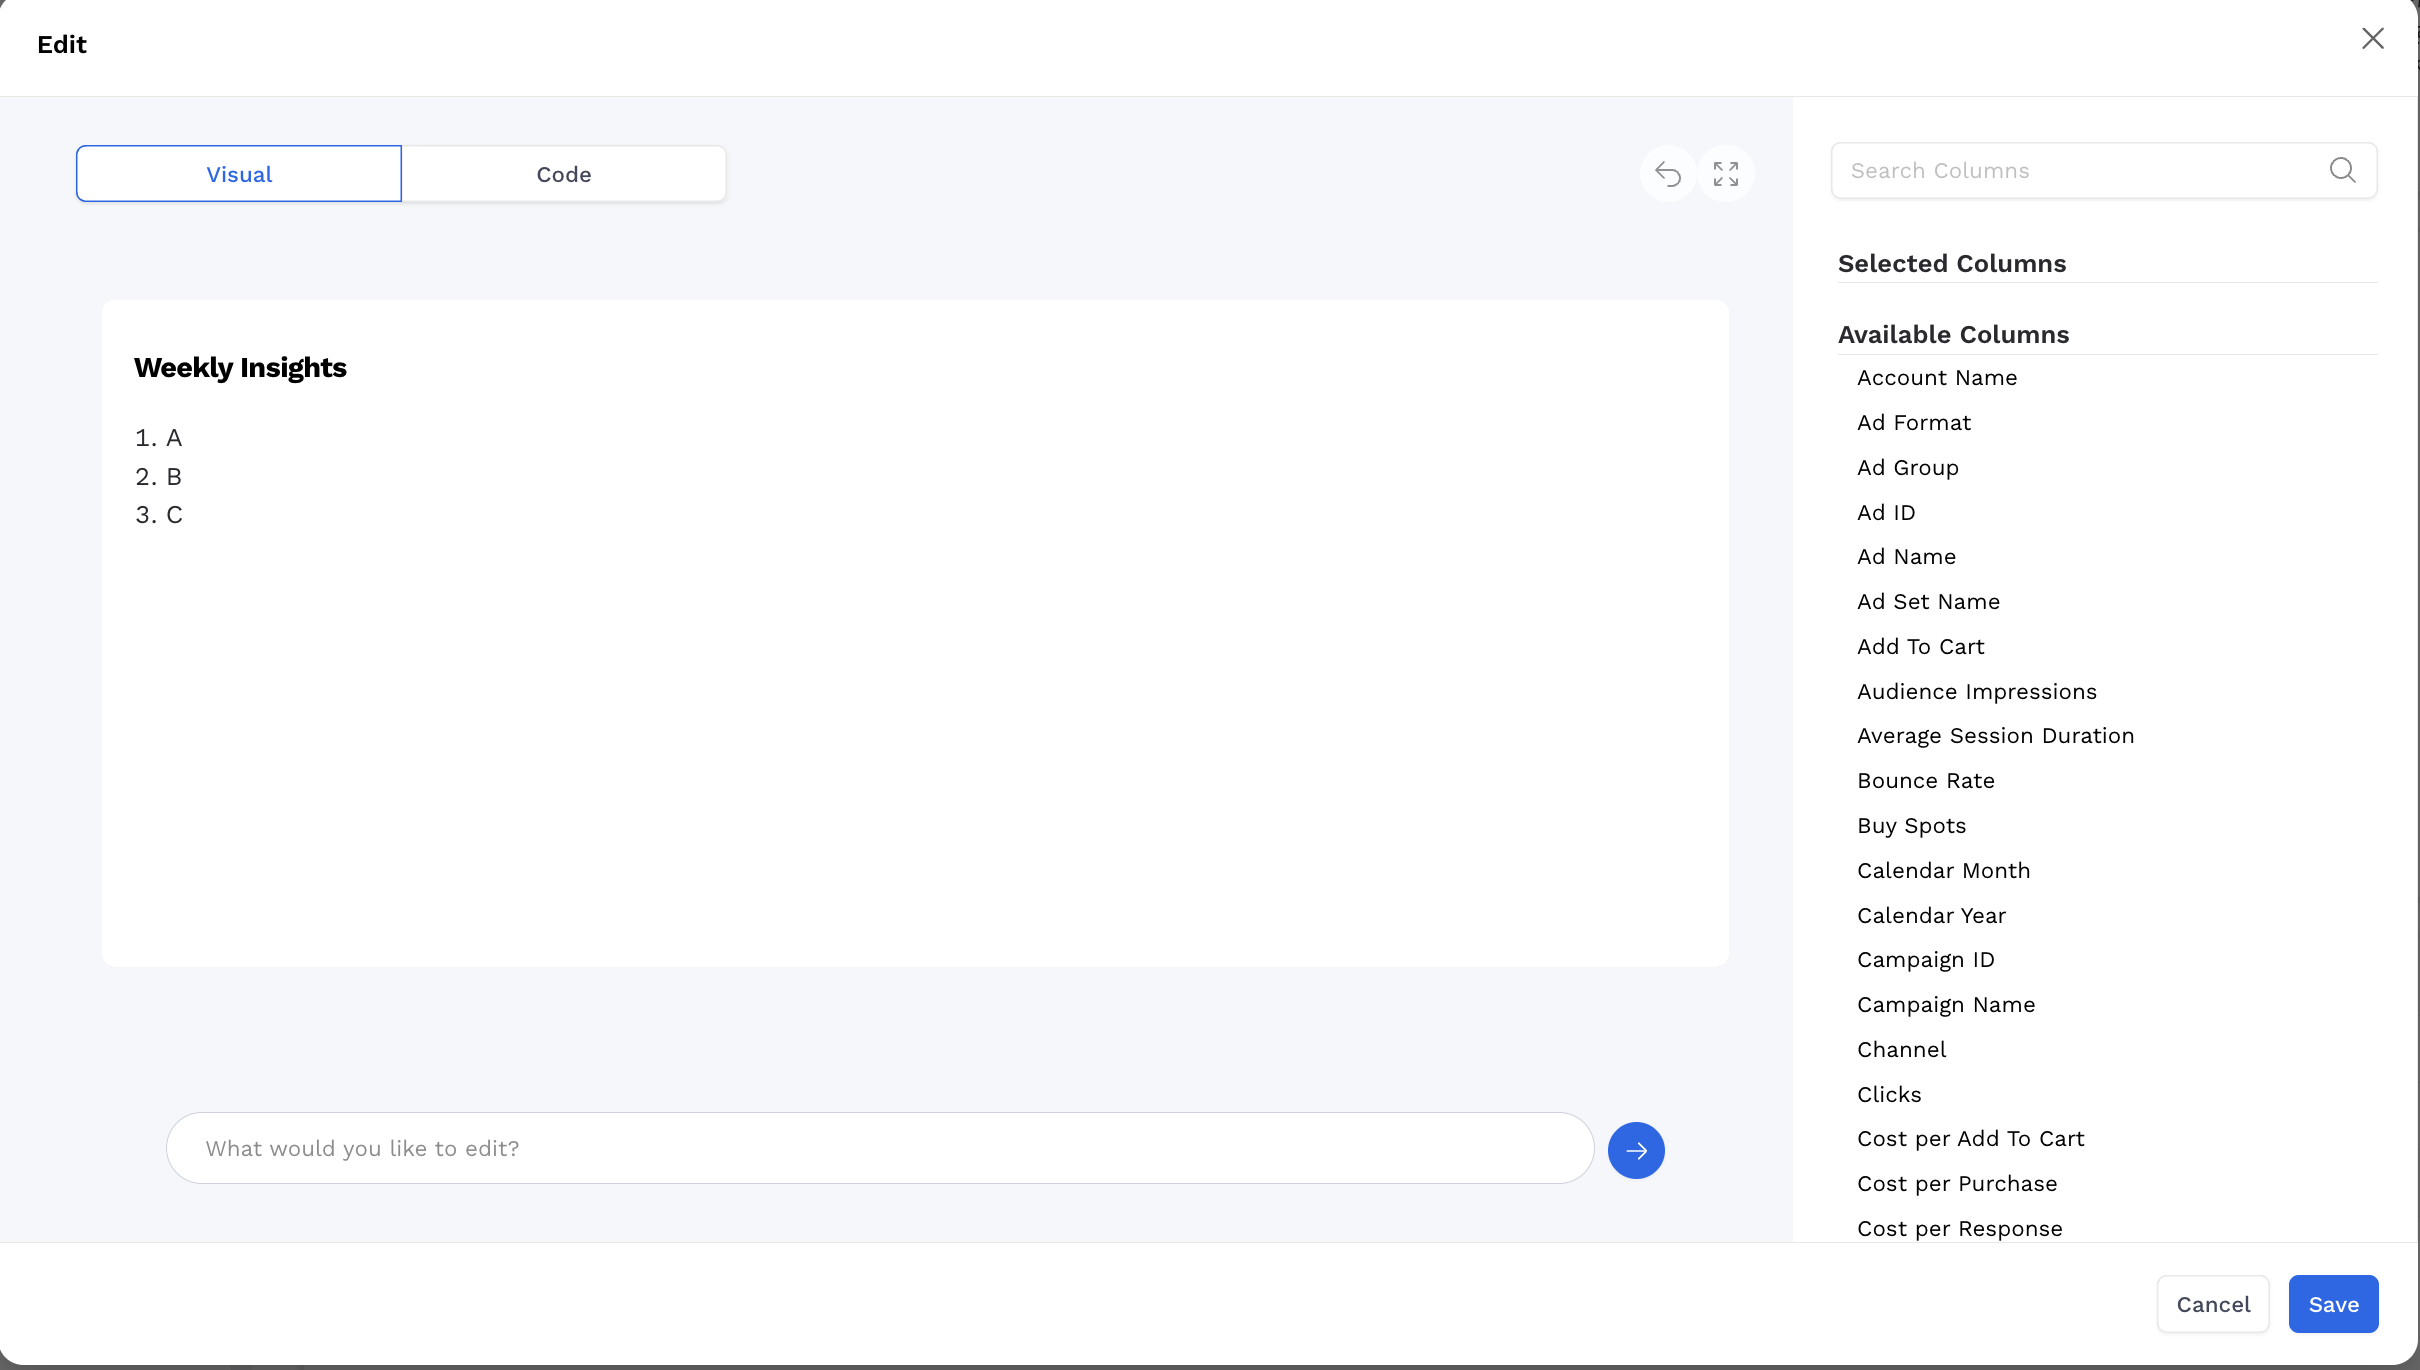
Paste a one‑liner:
Make this into a text box titled "Weekly Insights" with the content:
1) A
2) B
3) C
-
Save. Resize the card if needed using the code view.
-
Switch to code view by clicking on code at the top
-
Resize Instructions
-
Change
height: Replace'100%'with a fixed pixel value (e.g.,'300px') or'auto'. -
Add
width: You can explicitly set width too (e.g.,'600px'). -
Text size: Adjust
fontSizeglobally (18px) or per section (title24px). -
Scroll behavior: Keep or remove
overflowY: 'scroll'depending on whether you want the content to scroll -
👉 For example:
-
-
style: {
  height: '400px',
  width: '700px',
  fontSize: '16px',
  overflowY: 'auto'
}
-
-
-
Make the changes mentioned beside the //
-
function HeroMetric({ data = [], comparisonData = [] }) {
  return React.createElement(
    'div',
    {
      className: 'rounded-lg w-full h-full p-5 bg-white',
      style: {
        display: 'flex',
        flexDirection: 'column',
        alignItems: 'flex-start',
        justifyContent: 'center',
        height: '100%',   // <— adjust this
        fontSize: '18px', // <— adjust text size
        color: '#292A2E',
        overflowY: 'scroll'
      }
    },
    [
      React.createElement(
        'div',
        { key: 'title', style: { fontSize: '24px', marginBottom: '10px' } },
        'Weekly Insights'   // <— update title here
      ),
      React.createElement(
        'ul',
        { key: 'list', style: { listStyleType: 'disc', paddingLeft: '20px', fontWeight: 'normal' } },
        [
          // replace list items here
        ].map((text, index) => React.createElement('li', { key: index }, text))
      )
    ]
  );
}
-
Notes: Text boxes are static (filters don’t change the text). Use one card at a time.
Option B — Code Drop‑In (copy/paste)
Use this when you want tighter control or to keep a reusable template. Replace the title ('Weekly Insights') and replace the list array with your content.
function HeroMetric({ data = [], comparisonData = [] }) {
  return React.createElement(
    'div',
    {
      className: 'rounded-lg w-full h-full p-5 bg-white',
      style: {
        display: 'flex',
        flexDirection: 'column',
        alignItems: 'flex-start',
        justifyContent: 'center',
        height: '100%',
        fontSize: '18px',
        color: '#292A2E',
        overflowY: 'scroll'
      }
    },
    [
      React.createElement('div', { key: 'title', style: { fontSize: '24px', marginBottom: '10px' } }, 'Weekly Insights'),
      React.createElement(
        'ul',
        { key: 'list', style: { listStyleType: 'disc', paddingLeft: '20px', fontWeight: 'normal' } },
        [
          'Cart Abandoners within Demand Gen are delivering top conversion rates among audiences targeted within the campaign (0.29% vs. 0.14% campaign rate). L30D site visitors have top CTR.',
          'Top Creative:',
          'Odeon: 15s',
          '15s ads generated the strongest VCR this week at 88.27% (vs. 54.81% for 30s).',
          'Fall Golf: 15s',
          'Similar to Odeon, Fall assets saw greater success at the 15s length at a 93.41% VCR vs 68.93% for 30s',
          'The :15s assets continue to outperform in completion rate, supporting shorter-form creative as the most effective for audience engagement.',
          ':30s assets continue to deliver higher CTRs while :15s creatives are delivering higher View Rates.'
        ].map((text, index) => React.createElement('li', { key: index }, text))
      )
    ]
  );
}
Replace:
-
'Weekly Insights'→ your title -
The array of strings → your bullets
Style tips: Keep each bullet short; split long thoughts into separate lines for readability.
Troubleshooting
-
If nothing changes, ensure you’re editing the correct card and saved your changes.
-
If content clips, resize the card.