Steps to create:
-
Select a chart you want to replace the calendar heatmap with and go to the code view
-
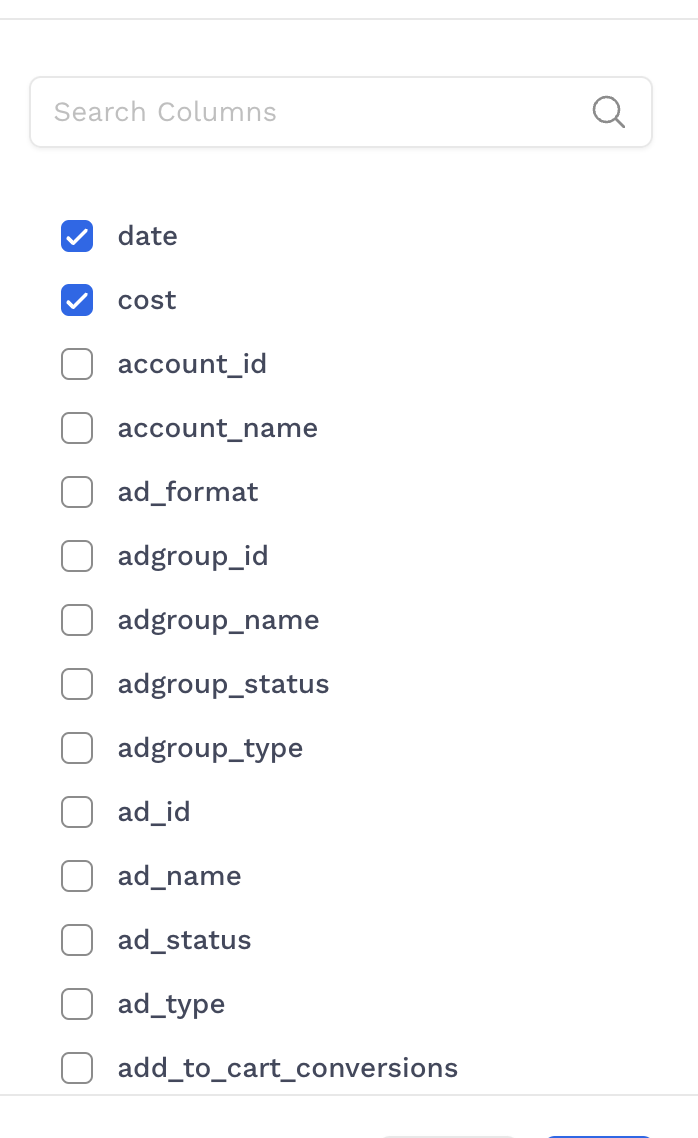
Select the Date Column and the metric you want to display
-
-
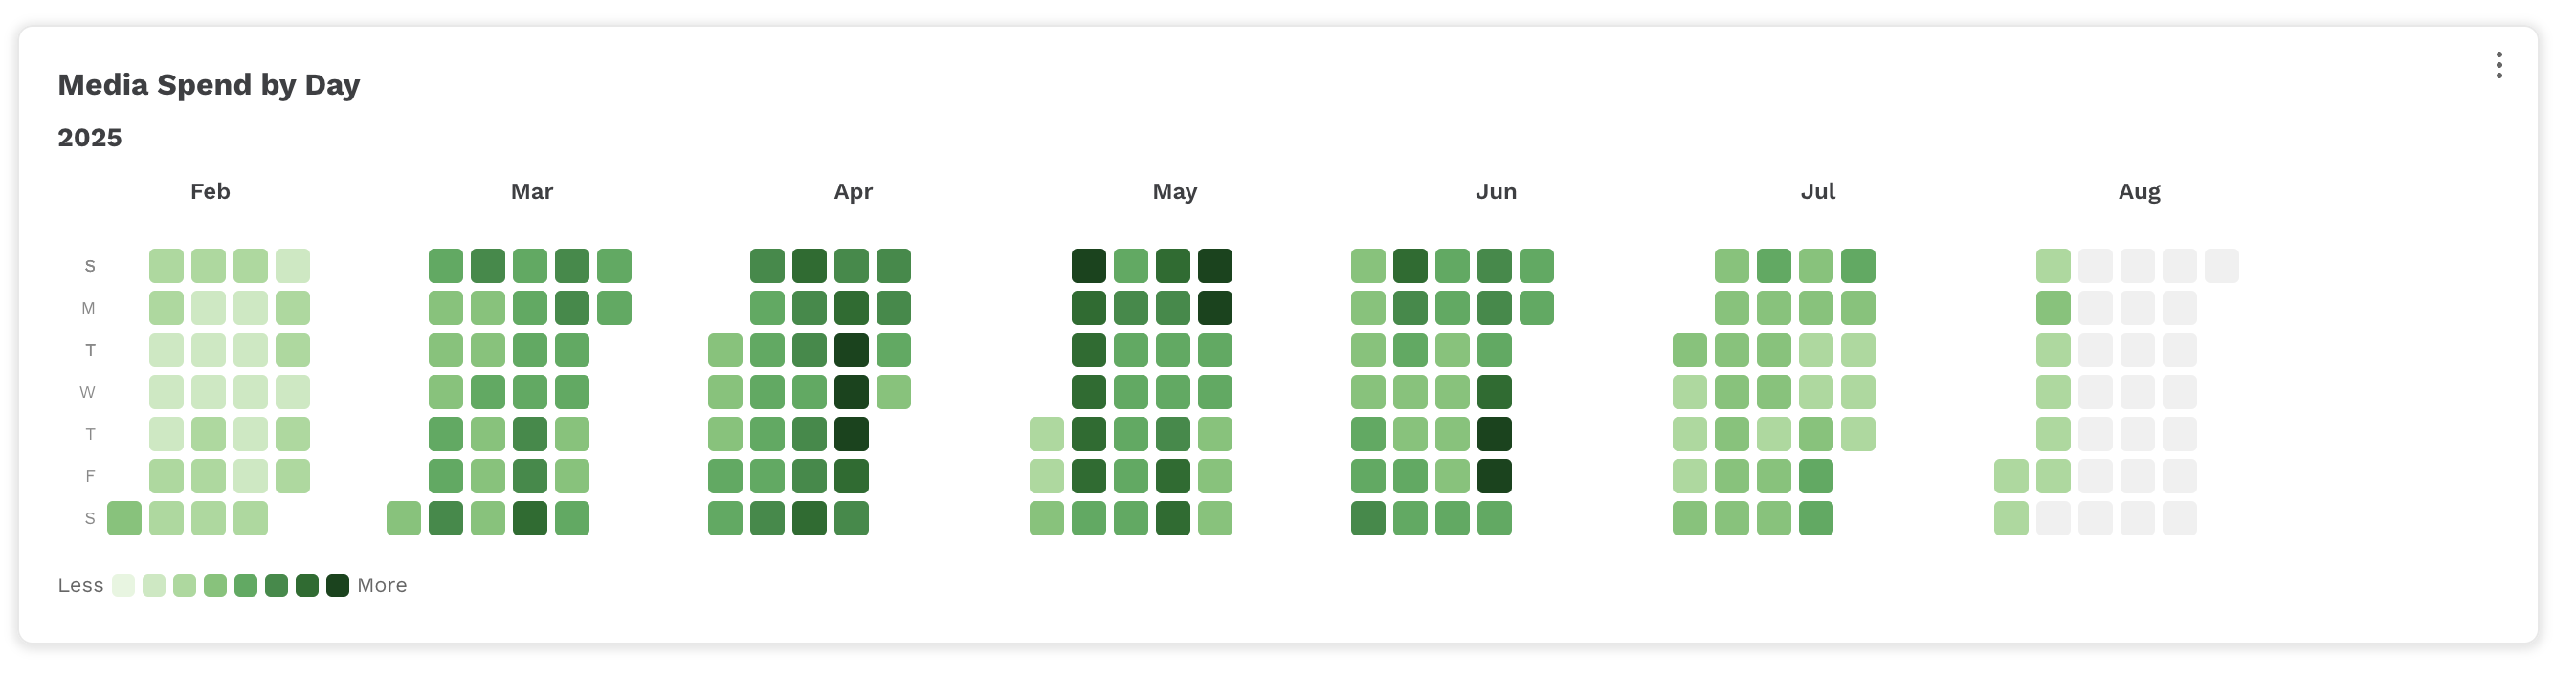
Paste the following code, replace the
dateColumn,metricColumnandmetricPrefixto the date and metric column you selected. If the metric is not a currency, change themetricPrefixto remove the dollar sign:JavaScriptfunction CalendarHeatmapByDay({ data = [] }) { const dateColumn = 'date'; const metricColumn = 'cost'; const metricPrefix = '$'; const byDate = new Map(); const yearsSet = new Set(); data.forEach(item => { if (!item[dateColumn]) return; const [mm, dd, yyyy] = item[dateColumn].split("/").map(s => s.padStart(2, "0")); const iso = `${yyyy}-${mm}-${dd}`; yearsSet.add(yyyy); const v = Number(item[metricColumn]) || 0; byDate.set(iso, (byDate.get(iso) || 0) + v); }); const years = [...yearsSet].sort((a, b) => Number(a) - Number(b)); const monthNames = ["Jan", "Feb", "Mar", "Apr", "May", "Jun", "Jul", "Aug", "Sep", "Oct", "Nov", "Dec"]; const maxCost = byDate.size === 0 ? 0 : Math.max(...byDate.values()); const GREENS = [ "#e5f5e0", "#c7e9c0", "#a1d99b", "#74c476", "#41ab5d", "#238b45", "#006d2c", "#00441b" ]; const costs = Array.from(byDate.values()).filter(v => v > 0).sort((a, b) => a - b); const median = costs.length ? (costs[Math.floor((costs.length - 1) / 2)] + costs[Math.ceil((costs.length - 1) / 2)]) / 2 : 0; const absDevs = costs.map(v => Math.abs(v - median)).sort((a, b) => a - b); const mad = absDevs.length ? (absDevs[Math.floor((absDevs.length - 1) / 2)] + absDevs[Math.ceil((absDevs.length - 1) / 2)]) / 2 : 0; let scale = mad * 1.4826; if (!scale) { const min = costs.length ? costs[0] : 0; const max = costs.length ? costs[costs.length - 1] : 0; scale = (max - min) / 6 || 1; } const clamp = (x, lo, hi) => Math.max(lo, Math.min(hi, x)); const colorFor = cost => { if (cost <= 0 || !isFinite(cost)) return "#f0f0f0"; const z = (cost - median) / scale; const zClamped = clamp(z, -2.5, 2.5); const t = (zClamped + 2.5) / 5; const idx = Math.round(t * (GREENS.length - 1)); return GREENS[idx]; }; const daysInMonth = (y, m) => new Date(y, m + 1, 0).getDate(); const firstDow = (y, m) => new Date(y, m, 1).getDay(); const weeksInMonth = (y, m) => Math.ceil((firstDow(y, m) + daysInMonth(y, m)) / 7); const baseLabelCol = 18; const dim = 18; const dayGap = 4; var showWeekdayLabels = true; const showTooltip = (e, text) => { const tooltip = document.createElement('div'); tooltip.style.position = 'fixed'; tooltip.style.background = 'rgba(0,0,0,0.75)'; tooltip.style.color = '#fff'; tooltip.style.padding = '3px 6px'; tooltip.style.borderRadius = '3px'; tooltip.style.fontSize = '11px'; tooltip.style.pointerEvents = 'none'; tooltip.style.zIndex = '1000'; tooltip.innerHTML = text; document.body.appendChild(tooltip); const rect = e.target.getBoundingClientRect(); tooltip.style.top = `${rect.top - tooltip.offsetHeight - 4}px`; tooltip.style.left = `${rect.left + rect.width / 2 - tooltip.offsetWidth / 2}px`; e.target._tooltip = tooltip; }; const hideTooltip = (e) => { if (e.target._tooltip) { document.body.removeChild(e.target._tooltip); e.target._tooltip = null; } }; return React.createElement("div", { style: { padding: 12 } }, React.createElement("div", { style: { marginBottom: 8, fontSize: 16, fontWeight: 700 } }, "Media Spend by Day"), years.length === 0 ? React.createElement("div", { style: { color: "#666" } }, "No data.") : years.map(yyyy => React.createElement("div", { key: yyyy, style: { marginBottom: 12 } }, React.createElement("div", { style: { fontWeight: 700, fontSize: 14, marginBottom: 4 } }, yyyy), React.createElement("div", { style: { display: "grid", gridTemplateColumns: "repeat(auto-fill, 160px)", justifyContent: "start", gap: 8, // month gap alignItems: "start", gridAutoFlow: "row dense" } }, Array.from({ length: 12 }).map((_, mIndex0) => { const monthLabel = monthNames[mIndex0]; const weeks = weeksInMonth(Number(yyyy), mIndex0); const firstDay = firstDow(Number(yyyy), mIndex0); const tiles = []; const totalDays = daysInMonth(Number(yyyy), mIndex0); let hasData = false; const labelCol = showWeekdayLabels ? baseLabelCol : 0; const tileColStart = showWeekdayLabels ? 2 : 1; for (let d = 1; d <= totalDays; d++) { const dt = new Date(Number(yyyy), mIndex0, d); const dow = dt.getDay(); const week = Math.floor((firstDay + (d - 1)) / 7); const mm = String(mIndex0 + 1).padStart(2, "0"); const dd = String(d).padStart(2, "0"); const iso = `${yyyy}-${mm}-${dd}`; const cost = byDate.get(iso) || 0; if (cost > 0) hasData = true; tiles.push( React.createElement("div", { key: iso, style: { gridRow: dow + 2, gridColumn: week + tileColStart, width: dim, height: dim, borderRadius: 3, background: colorFor(cost), cursor: cost > 0 ? "pointer" : "default" }, onMouseEnter: (e) => showTooltip(e, `${monthLabel} ${d}, ${yyyy} — ${metricPrefix}${cost.toLocaleString(undefined, { minimumFractionDigits: 2, maximumFractionDigits: 2 })}`), onMouseLeave: hideTooltip }) ); } if (!hasData) return null; const weekdayLabels = showWeekdayLabels ? ["S", "M", "T", "W", "T", "F", "S"].map((lbl, i) => React.createElement("div", { key: lbl, style: { gridRow: i + 2, gridColumn: 1, width: baseLabelCol, textAlign: "right", paddingRight: 2, fontSize: 9, color: "#888", alignSelf: "center", justifySelf: "end", lineHeight: `${dim}px` } }, lbl) ) : []; showWeekdayLabels = false; return React.createElement("div", { key: `${yyyy}-${mIndex0}`, style: { maxWidth: "160px", borderRadius: 8, padding: 4, background: "#fff" } }, React.createElement("div", { style: { fontWeight: 600, fontSize: 12, marginBottom: 4, textAlign: "center" } }, monthLabel), React.createElement("div", { style: { display: "grid", gridTemplateColumns: `${showWeekdayLabels ? baseLabelCol + 'px ' : ''}repeat(${weeks}, ${dim}px)`, gridTemplateRows: `12px repeat(7, ${dim}px)`, gap: dayGap, alignItems: "center", justifyContent: "start" } }, showWeekdayLabels ? React.createElement("div", { style: { gridRow: 1, gridColumn: 1 } }) : null, ...Array.from({ length: weeks }).map((_, w) => React.createElement("div", { key: `w-${w}`, style: { gridRow: 1, gridColumn: w + tileColStart, fontSize: 9, color: "#aaa", justifySelf: "center" } }) ), ...weekdayLabels, ...tiles ) ); }) ) ) ), React.createElement("div", { style: { display: "flex", alignItems: "center", gap: 4, marginTop: 6 } }, React.createElement("span", { style: { fontSize: 11, color: "#666" } }, "Less"), ...GREENS.map((c, i) => React.createElement("div", { key: i, style: { width: 12, height: 12, borderRadius: 3, background: c } }) ), React.createElement("span", { style: { fontSize: 11, color: "#666" } }, "More") ) ); }