
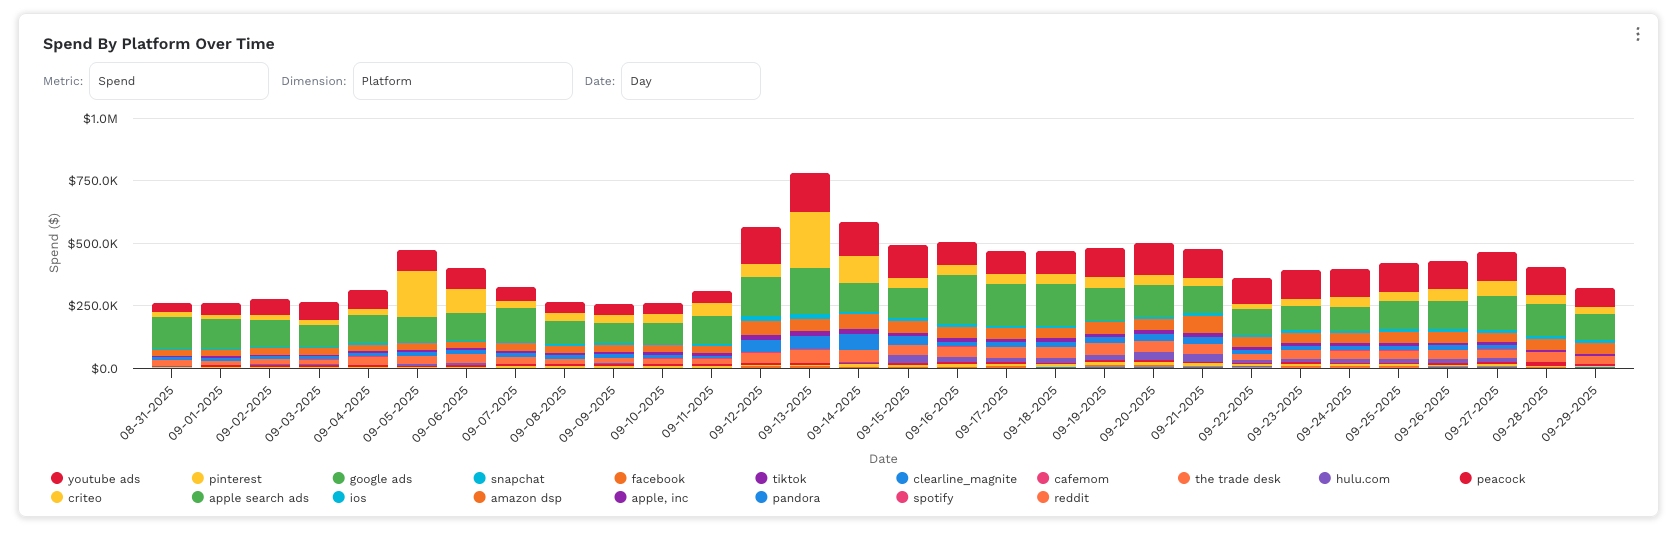
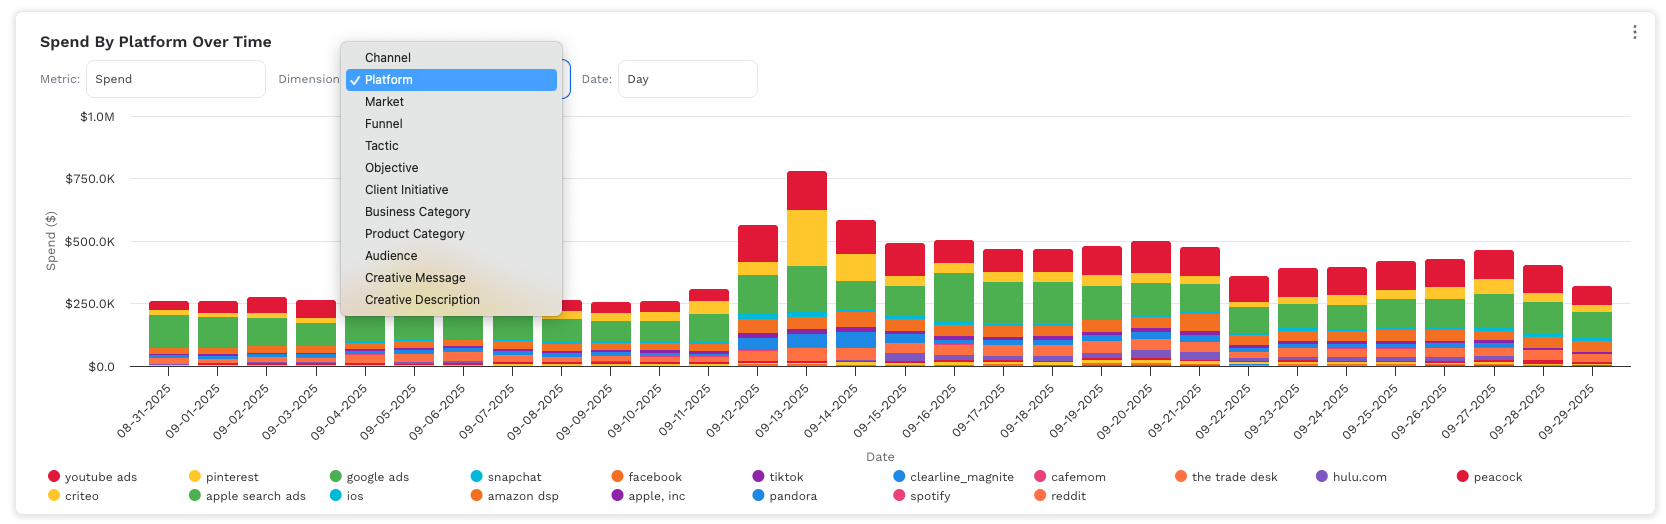
{Grain} {Metric} by {Dimension} Over Time.
A stacked column chart with the y-axis showing {Metric} and the x-axis showing {grain: day/week/month/year}. Each bar is divided by {Dimension}, so you can see how different segments contribute to the total over time. Use the dropdowns to change the metric or dimension.
Steps to create
-
Choose the slot & open Code View
Pick the visualization you want to replace and switch to Code. This mirrors the approach in our other “How to” docs (select a chart → go to code). -
Select the columns (minimum required)
-
One date column (e.g.,
date). -
Two or more candidate metrics you may want users to pick from (examples:
cost,impressions,clicks,conversions,revenue, etc.). -
One or more candidate dimensions that make sense to stack by (examples:
platform,channel,market,tactic,audience,business_category, etc.).
Tip: You’re not limited to revenue—include whatever KPIs matter for the client. Users just need at least one date field and two+ metrics to make the selector useful.
-
Paste the chart code
Paste the providedAreaChartcomponent into Code View (replacing the existing code). This follows the same “paste code then customize” pattern used in the other guides. -
Map to your client’s schema (critical!)
Update the Metric catalog and Dimension catalog so the accessors read from the right columns for your client:
-
Metrics: In
METRICS, change eachaccessor:to the correct field names (e.g., if the client usesmedia_spendinstead ofcost, pointspendatmedia_spend). -
Types/labels: Set
typetocurrency,number, orpercentto control axis/tooltip formatting. Renamelabelto the client’s terminology. -
Dimensions: In
DIMENSIONS, keep the flexible accessors (they try multiple name variants), or replace them with a single, exact column (e.g.,row => row.market_name). -
Defaults: Change
useState('spend')anduseState('platform')to the defaults you want selected on load.
-
Save, then verify behavior
-
Use the Metric and Dimension dropdowns to confirm stacks and totals look right.
-
Scan tooltips and axis ticks for correct formatting (currency vs number vs percent).
-
Spot-check a date or two against the table to confirm values align.
Editing later (what/where to tweak)
-
Add/remove a metric: add/remove an entry in
METRICS. -
Change a metric’s definition: update its
accessorfunction (e.g., switch revenue to a different column or compute a derived KPI). -
Add a new dimension: add to
DIMENSIONSwith anaccessorthat returns a string for that field. -
Branding: update the
colorsarray (stacks cycle through it). -
Performance: if there are many unique dimension values, consider pre-filtering to a top-N list before building
series.
Troubleshooting
-
Empty chart: check the date field is populated and parsable; verify your metric accessors return numbers (not strings/undefined).
-
Stacks look off: ensure the dimension accessor returns a single label per row (no arrays/objects) and isn’t blank/
null. -
Currency formatting wrong: confirm the metric’s
typeiscurrency; non-currency metrics should benumber/percent. -
Too many stacks: pre-filter or regroup the dimension (e.g., map granular placements to broader “Platform” values).
Use ChatGPT to help update this code with your clients metrics and dimensions
function AreaChart({ data = [], comparisonData = [] }) {
  const { useState, useMemo } = React;

  // ------- helpers -------
  const pick = (row, fields) => {
    for (const f of fields) {
      const v = row && row[f];
      if (v !== undefined && v !== null && String(v).trim() !== '') return v;
    }
    return null;
  };

  // Bucket a JS Date into UTC start of the chosen grain
  const bucketUTC = (d, grain) => {
    const year = d.getUTCFullYear();
    const month = d.getUTCMonth();
    const day = d.getUTCDate();

    if (grain === 'day') {
      return Date.UTC(year, month, day);
    }
    if (grain === 'week') {
      // Monday-start week
      const dow = d.getUTCDay();            // 0..6 (Sun..Sat)
      const delta = (dow + 6) % 7;          // days since Monday
      const monday = new Date(Date.UTC(year, month, day));
      monday.setUTCDate(monday.getUTCDate() - delta);
      return Date.UTC(monday.getUTCFullYear(), monday.getUTCMonth(), monday.getUTCDate());
    }
    if (grain === 'month') {
      return Date.UTC(year, month, 1);
    }
    if (grain === 'year') {
      return Date.UTC(year, 0, 1);
    }
    return Date.UTC(year, month, day);
  };

  const labelFormatFor = (grain) => {
    switch (grain) {
      case 'day':   return '{value:%m-%d-%Y}';
      case 'week':  return '{value:%m-%d-%Y}'; // start-of-week
      case 'month': return '{value:%b %Y}';
      case 'year':  return '{value:%Y}';
      default:      return '{value:%m-%d-%Y}';
    }
  };
  const tooltipDateFor = (ts, grain) => {
    if (grain === 'month')  return Highcharts.dateFormat('%b %Y', ts);
    if (grain === 'year')   return Highcharts.dateFormat('%Y', ts);
    if (grain === 'week')   return 'Week of ' + Highcharts.dateFormat('%m-%d-%Y', ts);
    return Highcharts.dateFormat('%m-%d-%Y', ts);
  };

  // Metric options
  const METRICS = [
    { key: 'spend',       label: 'Spend',          type: 'currency', accessor: (r) => Number(r.cost) || 0 },
    { key: 'clicks',      label: 'Clicks',         type: 'number',   accessor: (r) => Number(r.clicks) || 0 },
    { key: 'impressions', label: 'Impressions',    type: 'number',   accessor: (r) => Number(r.impressions) || 0 },
    { key: 'omni_rev',    label: 'Omni Revenue',   type: 'currency', accessor: (r) => Number(r.platform_omni_revenue) || 0 },
    { key: 'ecomm_rev',   label: 'Ecomm Revenue',  type: 'currency', accessor: (r) => Number(r.platform_ecomm_revenue) || 0 },
  ];

  // Dimension options (robust to name variants)
  const DIMENSIONS = [
    { value: 'channel',              label: 'Channel',              accessor: (i) => pick(i, ['channel','Channel']) },
    { value: 'platform',             label: 'Platform',             accessor: (i) => pick(i, ['platform','Platform']) },
    { value: 'market',               label: 'Market',               accessor: (i) => pick(i, ['market','Market']) },
    { value: 'funnel',               label: 'Funnel',               accessor: (i) => pick(i, ['funnel','Funnel']) },
    { value: 'tactic',               label: 'Tactic',               accessor: (i) => pick(i, ['tactic','Tactic']) },
    { value: 'objective',            label: 'Objective',            accessor: (i) => pick(i, ['objective','Objective']) },
    { value: 'client_initiative',    label: 'Client Initiative',    accessor: (i) => pick(i, ['client_initiative','Client Initiative']) },
    { value: 'business_category',    label: 'Business Category',    accessor: (i) => pick(i, ['business_category','Business Category','businessCategory','business category']) },
    { value: 'product_category',     label: 'Product Category',     accessor: (i) => pick(i, ['product_category','Product Category','productCategory','product category']) },
    { value: 'audience',             label: 'Audience',             accessor: (i) => pick(i, ['audience','Audience']) },
    { value: 'creative_message',     label: 'Creative Message',     accessor: (i) => pick(i, ['creative_message','Creative Message','creativeMessage','creative message']) },
    { value: 'creative_description', label: 'Creative Description', accessor: (i) => pick(i, ['creative_description','Creative Description','creativeDescription','creative description']) },
  ];

  const [metricKey, setMetricKey] = useState('spend');
  const [dimKey, setDimKey]       = useState('platform');
  const [dateGrain, setDateGrain] = useState('day'); // day | week | month | year

  const metricMeta = useMemo(() => METRICS.find(m => m.key === metricKey) || METRICS[0], [metricKey]);
  const dimMeta    = useMemo(() => {
    const found = DIMENSIONS.find(d => d.value === dimKey);
    return found || DIMENSIONS.find(d => d.value === 'platform') || DIMENSIONS[0];
  }, [dimKey]);

  // ------- aggregate by selected dimension × bucketed date -------
  const { seriesByDim, dimList } = useMemo(() => {
    const grouped = {}; // { dimValue: { bucketTs: value } }
    const allDatesSet = new Set();

    data.forEach(item => {
      const dimValRaw = dimMeta.accessor(item);
      const dimVal = (dimValRaw == null ? '' : String(dimValRaw)).trim();
      if (!dimVal || dimVal.toLowerCase() === 'null') return;

      const dateVal = item.calendardate;
      if (!dateVal) return;

      const d = new Date(dateVal);
      const bucketTs = bucketUTC(d, dateGrain);
      allDatesSet.add(bucketTs);

      if (!grouped[dimVal]) grouped[dimVal] = {};
      if (!grouped[dimVal][bucketTs]) grouped[dimVal][bucketTs] = 0;

      grouped[dimVal][bucketTs] += metricMeta.accessor(item);
    });

    const allDatesSorted = [...allDatesSet].sort((a, b) => a - b);

    const seriesByDim = {};
    Object.keys(grouped).forEach(val => {
      seriesByDim[val] = allDatesSorted.map(ts => [ts, grouped[val][ts] || 0]);
    });

    return { seriesByDim, dimList: Object.keys(seriesByDim) };
  }, [data, metricMeta, dimMeta, dateGrain]);

  const colors = ['#E11937','#FFC72C','#4CAF50','#00B8D9','#F36F21','#8E24AA','#1E88E5','#EC407A','#FF7043','#7E57C2'];

  // ------- formatting -------
  const abbrev = (v) => {
    const a = Math.abs(v);
    if (a >= 1_000_000_000) return (v / 1_000_000_000).toFixed(1) + 'B';
    if (a >= 1_000_000)     return (v / 1_000_000).toFixed(1) + 'M';
    if (a >= 1_000)         return (v / 1_000).toFixed(1) + 'K';
    return v.toFixed(1);
  };
  const fmtAxisTick = (type, v) => type === 'currency' ? ('$' + abbrev(v)) : abbrev(v);
  const fmtPoint = (type, v) => {
    if (type === 'currency') {
      const a = Math.abs(v);
      if (a >= 1_000_000_000) return '$' + (v / 1_000_000_000).toFixed(1) + 'B';
      if (a >= 1_000_000)     return '$' + (v / 1_000_000).toFixed(1) + 'M';
      if (a >= 1_000)         return '$' + (v / 1_000).toFixed(1) + 'K';
      return '$' + v.toFixed(1);
    }
    return abbrev(v);
  };

  const yAxisTitle   = metricMeta.type === 'currency' ? `${metricMeta.label} ($)` : metricMeta.label;
  const dynamicTitle = `${metricMeta.label} By ${dimMeta.label} Over Time`;

  // ------- chart -------
  const options = {
    chart: {
      type: 'column',
      marginTop: 10,
      marginBottom: 140,
      spacing: [8, 16, 16, 16],
      style: { fontFamily: 'Work Sans' }
    },
    title: { text: null },
    subtitle: { text: null },
    legend: {
      align: 'left',
      verticalAlign: 'bottom',
      layout: 'horizontal',
      itemStyle: { fontSize: '12px' },
      symbolHeight: 12,
      symbolWidth: 12,
      maxHeight: 60,
      x: 0, y: 20
    },
    xAxis: {
      title: { text: 'Date' },
      type: 'datetime',
      tickPixelInterval: 20,
      crosshair: { color: 'black', width: 1, dashStyle: 'Solid' },
      labels: { format: labelFormatFor(dateGrain) }
    },
    yAxis: {
      title: { text: yAxisTitle },
      labels: { formatter: function () { return fmtAxisTick(metricMeta.type, this.value); } }
    },
    tooltip: {
      shared: true,
      useHTML: true,
      backgroundColor: '#292A2EE5',
      borderRadius: 8,
      padding: 12,
      style: { color: '#FFFFFF', lineHeight: '20px' },
      formatter: function () {
        const dateLabel = tooltipDateFor(this.x, dateGrain);
        const lines = this.points.map(p =>
          `<span style="display:inline-block;vertical-align:middle;width:0.7rem;height:0.7rem;border-radius:50%;background-color:${p.color};margin-right:3px;"></span>
           <span style="vertical-align:middle;font-size:12px">${p.series.name}: ${fmtPoint(metricMeta.type, p.y)}</span>`
        ).join('<br/>');
        return `<span style="font-size:12px;display:block;margin-bottom:4px;">${dateLabel}</span>${lines}`;
      }
    },
    plotOptions: {
      column: { stacking: 'normal', groupPadding: 0.08, pointPadding: 0.02, borderWidth: 0 },
      series: { states: { hover: { enabled: true } } }
    },
    series: dimList.map((name, i) => ({
      type: 'column',
      name,
      data: seriesByDim[name],
      color: colors[i % colors.length]
    })),
    credits: { enabled: false },
    responsive: {
      rules: [{
        condition: { maxWidth: 600 },
        chartOptions: {
          xAxis: { labels: { style: { fontSize: '10px' } }, title: { style: { fontSize: '11px' } } },
          yAxis: { labels: { style: { fontSize: '10px' } }, title: { style: { fontSize: '11px' } } },
          legend: { itemStyle: { fontSize: '10px' }, symbolHeight: 10, symbolWidth: 10 },
          tooltip: { style: { fontSize: '10px' } }
        }
      }]
    }
  };

  // ------- header (title + Metric + Dimension + Date dropdowns) -------
  return (
    React.createElement('div', { style: { width: '100%' } },
      React.createElement('div', {
        style: { display: 'flex', flexDirection: 'column', gap: 8, marginBottom: 8, padding: '12px 16px 0 16px' }
      },
        React.createElement('div', {
          style: { fontFamily: 'Work Sans', fontWeight: 600, fontSize: 16, color: '#292A2E' }
        }, dynamicTitle),
        React.createElement('div', { style: { display: 'flex', alignItems: 'center', gap: 12, flexWrap: 'wrap' } },
          // Metric
          React.createElement('div', { style: { display: 'flex', alignItems: 'center', gap: 6 } },
            React.createElement('span', { style: { fontSize: 12, color: '#6B7280' } }, 'Metric:'),
            React.createElement('select', {
              value: metricKey, 'aria-label': 'Metric',
              onChange: (e) => setMetricKey(e.target.value),
              style: { fontFamily:'Work Sans', fontSize:12, padding:'6px 8px', borderRadius:8, border:'1px solid #E5E7EB', background:'#fff', width:180 }
            }, METRICS.map(m => React.createElement('option', { key: m.key, value: m.key }, m.label)))
          ),
          // Dimension
          React.createElement('div', { style: { display: 'flex', alignItems: 'center', gap: 6 } },
            React.createElement('span', { style: { fontSize: 12, color: '#6B7280' } }, 'Dimension:'),
            React.createElement('select', {
              value: dimKey, 'aria-label': 'Dimension',
              onChange: (e) => setDimKey(e.target.value),
              style: { fontFamily:'Work Sans', fontSize:12, padding:'6px 8px', borderRadius:8, border:'1px solid #E5E7EB', background:'#fff', width:220 }
            }, DIMENSIONS.map(d => React.createElement('option', { key: d.value, value: d.value }, d.label)))
          ),
          // Date grain
          React.createElement('div', { style: { display: 'flex', alignItems: 'center', gap: 6 } },
            React.createElement('span', { style: { fontSize: 12, color: '#6B7280' } }, 'Date:'),
            React.createElement('select', {
              value: dateGrain, 'aria-label': 'Date grain',
              onChange: (e) => setDateGrain(e.target.value),
              style: { fontFamily:'Work Sans', fontSize:12, padding:'6px 8px', borderRadius:8, border:'1px solid #E5E7EB', background:'#fff', width:140 }
            },
              ['day','week','month','year'].map(g => React.createElement('option', { key: g, value: g }, g.charAt(0).toUpperCase()+g.slice(1)))
            )
          )
        )
      ),
      React.createElement(HighchartsReact, { highcharts: Highcharts, options })
    )
  );
}