
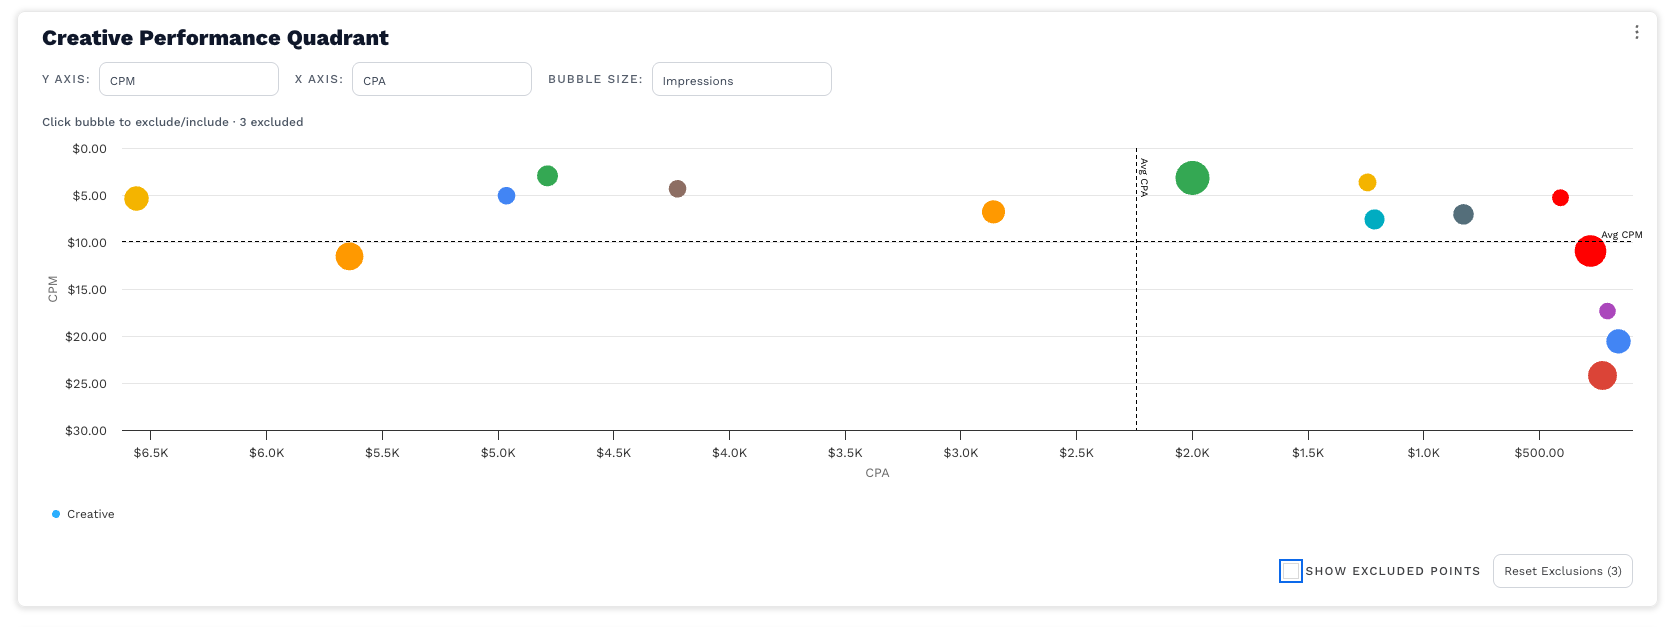
{Y Metric} vs. {X Metric}, bubble size = {Size Metric}.
A bubble scatterplot that compares {Y Metric} on the y-axis and {X Metric} on the x-axis, with bubble size representing {Size Metric}. Dashed lines mark the average X and Y values, creating four quadrants. Lower-is-better metrics (e.g., CPA/CPM/CPC) auto-flip axes for intuitive reading. Click any bubble to exclude/include it from the averages; toggle visibility of excluded points with the checkbox.
Steps to create
-
Paste the chart code
Replace the visualization’s code with the providedScatterChart -
Set sensible defaults (optional)
In the component’s state, choose initial metrics that make sense for the client:-
yMetric(defaultCPM) -
xMetric(defaultCPA) -
sizeMetric(defaultImpressions)
-
-
Map the grouping dimension to your client (critical)
In the “Group & base sums” block, the example groups bycreative_name:const key = item.creative_name || 'Unknown';-
Change
creative_nameto the dimension you need (e.g.,platform,channel,market,campaign_name). -
This value becomes the point label and the exclusion key (what gets toggled on click).
-
-
Map the base metrics used for calculations
The code currently accumulates:
Experian exampleimpressions -> item.impressions media_spend -> item.media_spend clicks -> item.clicks cda_new_reg -> item.cda_new_reg // replace with your conversions field-
Replace any field names to match your schema (e.g.,
media_spend→cost;cda_new_reg→total_new_regorconversions).
-
-
Review/adjust metric formulas
The chart derives KPIs from the base sums:-
CTR = clicks ÷ impressions
-
CPA = spend ÷ registrations (or your conversion field)
-
CPM = (spend ÷ impressions) × 1,000
-
CPC = spend ÷ clicks
-
Media Spend, Impressions, Clicks, Total New Registration = totals
Edit these in thecalcobject if your definitions differ (e.g., use a different conversion column).
-
-
Control which metrics appear in the dropdowns
-
X & Y axis options are defined by
axisMetricOptions. -
Bubble size options are defined by
sizeMetricOptions.
Add/remove labels there to reflect the KPIs you want exposed. If your client has no conversions, simply removeCPAandTotal New Registrationfrom the lists.
-
-
Formatting (currency/percent/number)
The chart auto-formats by metric:-
Currency:
CPA,CPM,CPC,Media Spend -
Percent:
CTR -
Count:
Impressions,Clicks,Total New Registration
Adjust theisCurrency/isPercenthelpers if you add custom KPIs.
-
-
Exclusions & outliers
-
Click a bubble to exclude/include it from averages (label shows “(excluded)” in tooltip).
-
Show excluded points toggle determines whether excluded bubbles appear greyed out.
-
Reset Exclusions clears the set.
-
Optional outlier filter hides extreme points (> 3σ on X or Y) when
filterOutliersprop istrue. Keep itfalseunless you need it.
-
-
Quadrant labels & averages
-
The chart draws average X and Y lines and automatically places quadrant helper labels.
-
For cost-type metrics (
CPA,CPM,CPC), axes are reversed so “lower is better” appears toward the top-left quadrant.
-
-
Branding & UX (optional)
-
Update the
colorsarray for brand colors.
-
Save and validate
-
Try different combinations of X, Y, Bubble.
-
Click several bubbles to confirm exclude/restore works and averages update.
-
Sanity-check tooltips/axes for correct formatting and units.
Troubleshooting
-
Empty plot / missing points: check your group-by field isn’t empty and metric formulas return finite numbers (NaN/null are filtered out).
-
CPA or CTR shows “—”: make sure the required base fields are populated (e.g., conversions for CPA, impressions for CTR).
-
Everything looks tiny: if bubble sizes are all near zero, switch the Bubble metric to a larger-range metric (e.g., Impressions).
-
Averages look off: remember excluded points are not included in the averages; click Reset Exclusions to recompute.
Use ChatGPT to help update this code with your clients metrics and dimensions
// V6.5 — match Daily Trend layout: Title, controls row (left), small subtitle, chart, controls bottom-right
function ScatterChart({
  data = [],
  comparisonData = [],
  filterOutliers = false,
  initialExcluded = [],
  onExcludedChange
}) {
  const [excluded, setExcluded] = React.useState(new Set(initialExcluded));
  const [showExcluded, setShowExcluded] = React.useState(true);

  // Defaults
  const [yMetric, setYMetric] = React.useState('CPM');
  const [xMetric, setXMetric] = React.useState('CPA');
  const [sizeMetric, setSizeMetric] = React.useState('Impressions');

  const toggleExclude = React.useCallback((name) => {
    setExcluded(prev => {
      const next = new Set(prev);
      if (next.has(name)) next.delete(name); else next.add(name);
      onExcludedChange && onExcludedChange(Array.from(next));
      return next;
    });
  }, [onExcludedChange]);

  const resetExclusions = React.useCallback(() => {
    setExcluded(new Set());
    onExcludedChange && onExcludedChange([]);
  }, [onExcludedChange]);

  // ---------- Group & base sums ----------
  const grouped = {};
  data.forEach(item => {
    const key = item.creative_name || 'Unknown';
    if (!grouped[key]) grouped[key] = { impressions: 0, media_spend: 0, clicks: 0, cda_new_reg: 0 };
    grouped[key].impressions += Number(item.impressions) || 0;
    grouped[key].media_spend += Number(item.media_spend) || 0;
    grouped[key].clicks      += Number(item.clicks) || 0;
    grouped[key].cda_new_reg += Number(item.cda_new_reg) || 0;
  });

  // ---------- Metric calculators ----------
  const calc = {
    'CTR': g => (g.impressions > 0 ? g.clicks / g.impressions : null),
    'CPA': g => (g.cda_new_reg > 0 ? g.media_spend / g.cda_new_reg : null),
    'CPM': g => (g.impressions > 0 ? (g.media_spend / g.impressions) * 1000 : null),
    'CPC': g => (g.clicks > 0 ? g.media_spend / g.clicks : null),
    'Media Spend': g => (g.media_spend || null),
    'Impressions': g => (g.impressions || null),
    'Clicks': g => (g.clicks || null),
    'Total New Registration': g => (g.cda_new_reg || null) // switch to total_new_reg if you prefer
  };

  const isCurrency = (m) => ['CPA','CPM','CPC','Media Spend'].includes(m);
  const isPercent  = (m) => m === 'CTR';
  const formatCurrency = (val) => {
    if (!Number.isFinite(val)) return '—';
    if (val >= 1_000_000) return '$' + (val / 1_000_000).toFixed(1) + 'M';
    if (val >= 1_000)     return '$' + (val / 1_000).toFixed(1) + 'K';
    return '$' + val.toFixed(2);
  };
  const formatPercent = (v) => Number.isFinite(v) ? (v * 100).toFixed(2) + '%' : '—';
  const formatCount = (v) => Number.isFinite(v) ? (v >= 1_000 ? (v/1_000).toFixed(1)+'K' : Math.round(v).toString()) : '—';
  const formatByMetric = (m, v) => isCurrency(m) ? formatCurrency(v) : (isPercent(m) ? formatPercent(v) : formatCount(v));
  const metricLabel = (m) => m;

  // ---------- Build points ----------
  let points = Object.keys(grouped).map(name => {
    const g = grouped[name];
    return {
      name,
      x: calc[xMetric](g),
      y: calc[yMetric](g),
      sizeVal: calc[sizeMetric](g),
      impressions: g.impressions, clicks: g.clicks, media_spend: g.media_spend, regs: g.cda_new_reg
    };
  }).filter(d => Number.isFinite(d.x) && Number.isFinite(d.y));

  // ---------- Outlier filter ----------
  const mean = arr => arr.reduce((s, v) => s + v, 0) / (arr.length || 1);
  const stddev = arr => { if (arr.length < 2) return 0; const m = mean(arr); return Math.sqrt(mean(arr.map(v => (v - m) ** 2))); };
  let filtered = points;
  if (filterOutliers && points.length) {
    const xs = points.map(d => d.x), ys = points.map(d => d.y);
    const cutX = mean(xs) + 3 * stddev(xs), cutY = mean(ys) + 3 * stddev(ys);
    const tmp = points.filter(d => d.x <= cutX && d.y <= cutY);
    filtered = tmp.length ? tmp : points;
  }

  // ---------- Exclusions & stats ----------
  const includedPoints = filtered.filter(d => !excluded.has(d.name));
  const excludedPoints = filtered.filter(d => excluded.has(d.name));
  const statsBase = includedPoints.length ? includedPoints : filtered;

  const avgX = mean(statsBase.map(d => d.x));
  const avgY = mean(statsBase.map(d => d.y));

  const maxSize = Math.max(0, ...statsBase.map(d => d.sizeVal || 0));
  const radiusFor = (v) => {
    if (!Number.isFinite(v) || v <= 0 || !Number.isFinite(maxSize) || maxSize <= 0) return 5;
    const r = 3 + 14 * (Math.sqrt(v) / Math.sqrt(maxSize));
    return Math.max(3, Math.min(20, r));
  };

  const lowerIsBetter = (m) => ['CPA','CPM','CPC'].includes(m);
  const xReversed = lowerIsBetter(xMetric);
  const yReversed = lowerIsBetter(yMetric);

  const colors = ['#34A853','#FF9900','#FF0000','#4285F4','#DB4437','#F4B400','#AB47BC','#00ACC1','#8D6E63','#546E7A'];

  // ---------- Highcharts ----------
  const options = {
    chart: {
      type: 'scatter',
      marginTop: 10,            // align with other charts that use 16px title padding
      marginBottom: 110,
      spacing: [8,16,16,16],
      style: { fontFamily: 'Work Sans' },
      zoomType: 'xy',
      resetZoomButton: { theme: { fill:'white', stroke:'silver', r:0, style:{ color:'#333' }, states:{ hover:{ fill:'#e6e6e6' } } },
                         position: { align:'right', verticalAlign:'top', x:-10, y:6 } },
      events: {
        render: function () {
          const chart = this, xAxis = chart.xAxis[0], yAxis = chart.yAxis[0];
          if (!xAxis || !yAxis || !statsBase.length) return;
          const xs = statsBase.map(d=>d.x), ys = statsBase.map(d=>d.y);
          const minX = Math.min(...xs), maxX = Math.max(...xs);
          const minY = Math.min(...ys), maxY = Math.max(...ys);
          const xLowMid=(minX+avgX)/2, xHighMid=(avgX+maxX)/2, yLowMid=(minY+avgY)/2, yHighMid=(avgY+maxY)/2;
          const place = (id, text, xv, yv) => {
            const px = xAxis.toPixels(xv), py = yAxis.toPixels(yv);
            const w=180,h=16;
            chart._quadLabels=chart._quadLabels||{};
            const node = chart._quadLabels[id] || (chart._quadLabels[id]=
              chart.renderer.label(text, px-w/2, py-h/2, undefined, undefined, undefined, true)
                .css({ color:'#555', fontSize:'10.5px', fontWeight:600, pointerEvents:'none', textAlign:'center' })
                .attr({ padding:2, zIndex:5 }));
            node.attr({ text, x:px-w/2, y:py-h/2, width:w, height:h });
          };
          place('bl', 'High ' + yMetric + ', High ' + xMetric,  xHighMid, yHighMid);
          place('br', 'Low '  + yMetric + ', High ' + xMetric,  xLowMid,  yHighMid);
          place('tr', 'Low '  + yMetric + ', Low '  + xMetric,  xLowMid,  yLowMid);
          place('tl', 'High ' + yMetric + ', Low '  + xMetric,  xHighMid, yLowMid);
        }
      }
    },
    title: { text: null }, subtitle: { text: null },
    xAxis: {
      title: { text: metricLabel(xMetric) },
      labels: { formatter: function () { return formatByMetric(xMetric, this.value); } },
      reversed: xReversed,
      crosshair: { color: 'black', width: 1, dashStyle: 'Solid' },
      plotLines: [{ value: avgX, color:'#000', dashStyle:'Dash', width:1, zIndex:3,
                    label:{ text:'Avg ' + metricLabel(xMetric), align:'left', style:{ color:'#000', fontSize:'10px' } } }]
    },
    yAxis: {
      title: { text: metricLabel(yMetric) },
      labels: { formatter: function () { return formatByMetric(yMetric, this.value); } },
      reversed: yReversed,
      plotLines: [{ value: avgY, color:'#000', dashStyle:'Dash', width:1, zIndex:3,
                    label:{ text:'Avg ' + metricLabel(yMetric), align:'right', style:{ color:'#000', fontSize:'10px' } } }]
    },
    tooltip: {
      useHTML:true, backgroundColor:'#292A2EE5', borderRadius:8, padding:10,
      style:{ color:'#FFFFFF', lineHeight:'18px', fontSize:'11.5px' },
      formatter: function () {
        const isEx = excluded && excluded.has(this.point.name);
        return '<b style="font-size:12px">' + this.point.name + (isEx ? ' (excluded)' : '') + '</b><br/>' +
               metricLabel(xMetric) + ': ' + formatByMetric(xMetric, this.point.x) + '<br/>' +
               metricLabel(yMetric) + ': ' + formatByMetric(yMetric, this.point.y) + '<br/>' +
               'Bubble (' + metricLabel(sizeMetric) + '): ' + formatByMetric(sizeMetric, this.point.sizeVal) + '<br/>' +
               '<span style="opacity:.8">Click to ' + (isEx ? 'include' : 'exclude') + '</span>';
      }
    },
    legend: { enabled:true, align:'left', verticalAlign:'bottom', layout:'horizontal',
              itemStyle:{ fontSize:'12px' }, symbolHeight:12, symbolWidth:12, symbolRadius:0, x:0, y:0, maxHeight:56 },
    plotOptions: {
      scatter: {
        cursor:'pointer',
        marker:{ symbol:'circle', states:{ hover:{ enabled:true, lineColor:'black' } } },
        point:{ events:{ click:function(){ toggleExclude(this.name); } } }
      },
      series:{ animation:true, turboThreshold:0 }
    },
    series: [
      { name:'Creative',
        data: includedPoints.map((p,i)=>({ name:p.name, x:p.x, y:p.y, sizeVal:p.sizeVal,
                                           marker:{ radius: radiusFor(p.sizeVal), fillColor: colors[i%colors.length] } })) }
    ].concat(showExcluded ? [{
      name:'Excluded (hidden from avgs)',
      data: excludedPoints.map(p=>({ name:p.name, x:p.x, y:p.y, sizeVal:p.sizeVal,
                                     marker:{ radius: radiusFor(p.sizeVal), fillColor:'#9e9e9e' } })),
      opacity:0.35
    }] : []),
    credits: { enabled:false }
  };

  // ---------- UI (header matches the other chart’s title formatting) ----------
  const axisMetricOptions = ['CTR','CPA','CPM','CPC','Media Spend','Impressions','Clicks'];
  const sizeMetricOptions = ['Impressions','Clicks','Media Spend','Total New Registration'];

  const Picker = function ({label, value, onChange, options}) {
    return React.createElement('label', { style:{ display:'flex', alignItems:'center', gap:6, fontSize:12, color:'#374151' } }, [
      React.createElement('span', { key:'l', style:{ opacity:.85 } }, label),
      React.createElement('select', {
        key:'s', value:value, onChange:function(e){ onChange(e.target.value); },
        style:{ padding:'6px 8px', border:'1px solid #E5E7EB', borderRadius:8, fontSize:12, minWidth:180, height:34, background:'#fff', fontFamily:'Work Sans' }
      }, options.map(function (m) { return React.createElement('option', { key:m, value:m }, m); }))
    ]);
  };

  return React.createElement('div', { style:{ width:'100%' } }, [
    // Header container: title + controls (matches other component)
    React.createElement('div', {
      key:'hdr',
      style:{ display:'flex', flexDirection:'column', gap:8, marginBottom:8, padding:'12px 16px 0 16px' }
    }, [
      // Title (same formatting as the other code)
      React.createElement('div', {
        key:'title',
        style:{ fontFamily:'Work Sans', fontWeight:600, fontSize:16, color:'#292A2E' }
      }, 'Creative Performance Quadrant'),

      // Controls row (left-aligned)
      React.createElement('div', {
        key:'controls',
        style:{ display:'flex', alignItems:'center', gap:12, flexWrap:'wrap' }
      }, [
        React.createElement(Picker, { key:'y', label:'Y axis:', value:yMetric, onChange:setYMetric, options: axisMetricOptions }),
        React.createElement(Picker, { key:'x', label:'X axis:', value:xMetric, onChange:setXMetric, options: axisMetricOptions }),
        React.createElement(Picker, { key:'size', label:'Bubble:', value:sizeMetric, onChange:setSizeMetric, options: sizeMetricOptions })
      ])
    ]),

    // Small subtitle (kept, but spaced to align with header rhythm)
    React.createElement('div', { key:'subtitle',
      style:{ padding:'0 16px', fontSize:12, color:'#4B5563', fontWeight:500 }
    }, 'Click bubble to exclude/include · ' + excluded.size + ' excluded'),

    // Chart
    React.createElement('div', { key:'chartwrap' }, [
      React.createElement(HighchartsReact, { key:'chart', highcharts: Highcharts, options })
    ]),

    // Bottom-right controls
    React.createElement('div', { key:'bottom-controls',
      style:{ display:'flex', alignItems:'center', gap:12, alignSelf:'flex-end', padding:'6px 16px 10px 16px' } }, [
      React.createElement('label', { key:'toggle', style:{ display:'flex', alignItems:'center', gap:6, fontSize:12 } }, [
        React.createElement('input', { type:'checkbox', checked:showExcluded, onChange:function(e){ setShowExcluded(e.target.checked); } }),
        'Show excluded points'
      ]),
      React.createElement('button', { key:'reset', onClick:resetExclusions,
        style:{ padding:'6px 10px', border:'1px solid #d1d5db', background:'#fff', borderRadius:8, cursor:'pointer', fontSize:12 } },
        'Reset Exclusions (' + excluded.size + ')')
    ])
  ]);
}