
Similar to the data table in Data Export
What it shows
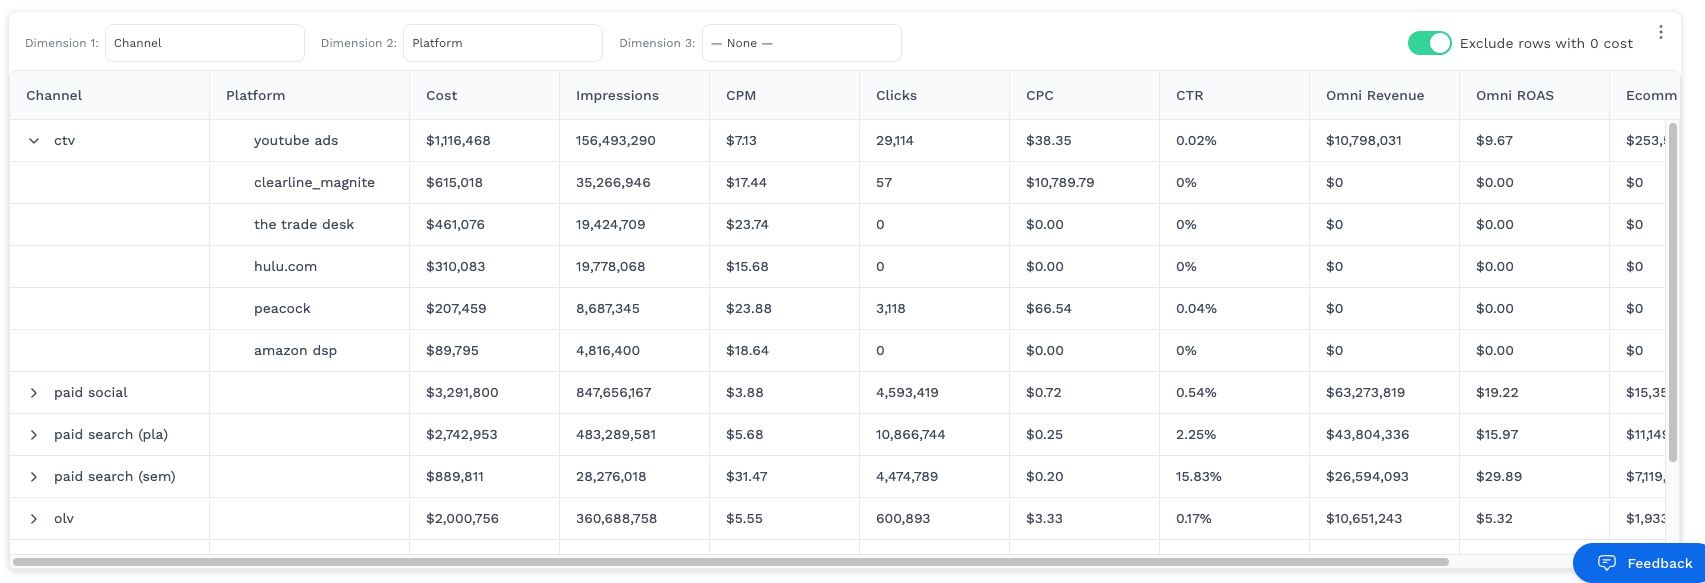
An interactive table that aggregates metrics by up to three dimensions (e.g., Platform → Campaign → Placement). It auto-computes CPM, CPC, CTR, Ecomm ROAS, Omni ROAS, supports grand totals, and includes a toggle to exclude rows with 0 cost.
Steps to create
-
Choose a tile & open Code view
Select the visualization you want to replace in your dashboard, then switch to Code. -
Select columns (flexible across clients)
Pick the columns you’ll need:
-
At least one to three dimensions you might want to group by (e.g.,
platform,channel,market,campaign_name,placement_name, etc.). -
Base metrics you want to aggregate, commonly:
-
Required for most KPIs:
cost(or your spend field),impressions,clicks -
Optional for revenue/ROAS KPIs:
platform_ecomm_revenue,platform_offline_revenue(used to calculate Omni Revenue and ROAS)
-
-
Paste the component
Replace the tile’s code with thePivotTablecomponent and save. -
Map to your client’s schema (critical!)
Update the places below so the table reads your fields correctly.
-
Dimensions (
DIM_OPTIONS)-
Each item has an
accessorthat tries multiple name variants (e.g.,platformvsPlatform). -
Add any client-specific dims (e.g.,
brand,product_line) or replace the accessor with an exact column if needed. -
The three dropdowns (“Dimension 1/2/3”) are driven by this list.
-
-
Default dimensions
-
Set
dim1,dim2,dim3to helpful defaults for your client (e.g.,platform,campaign_name,placement_name).
-
-
Revenue optionality
-
If the client doesn’t have revenue, you can keep those columns (they’ll compute as $0) or remove revenue/ROAS from the default metric list (see “Columns & formatting” below).
-
-
Understand how aggregation & KPIs work
-
The component groups rows by the active dimensions and sums numeric fields.
-
Calculated KPIs are built on those sums:
-
CPM = cost / impressions × 1,000
-
CPC = cost / clicks
-
CTR = clicks / impressions
-
Ecomm ROAS = ecomm revenue / cost
-
Omni ROAS = (ecomm + offline revenue) / cost
-
-
For Omni Revenue, the column definition adds
platform_ecomm_revenue + platform_offline_revenue.
-
Columns, formatting, and calculated metrics
-
The grid defines:
-
Default displayed metrics:
cost, impressions, cpm, clicks, cpc, ctr, omni_revenue, omni_roas, platform_ecomm_revenue, ecomm_roas. -
Calculated metric getters/aggregators for
cpm, cpc, ctr, ecomm_roas, omni_roas.
-
-
Formatting
-
Currency whole-number:
cost, omni_revenue, platform_ecomm_revenue -
Currency 2-decimals:
cpm, cpc, omni_roas, ecomm_roas -
Percent:
ctr -
Number:
impressions, clicks
-
-
Rename headers via
prettyHeader(e.g., change “platform_ecomm_revenue” → “Ecomm Revenue”). -
To add/remove a metric column:
-
Add it to the loop that builds columns (or remove it).
-
If derived, add its
valueGetterandaggFuncto the calculated maps. -
Add it to the appropriate formatting array.
-
-
Zero-cost toggle (UX control)
Use the Exclude rows with 0 cost toggle in the header to filter out any rows whose aggregatedcostequals 0. This affects the grid rowData only (totals and calculations reflect the filtered set). -
Grand total & grouping behavior
-
grandTotalRow: trueadds a footer row labeled Total. -
pivotMode: truewithgroupDisplayType: 'multipleColumns'shows grouped dims as separate columns on the left. -
The auto-group column hides counts and displays “Total” only on the top footer.
-
Save & validate
-
Try different Dimension 1/2/3 combinations.
-
Confirm CPM/CPC/CTR/ROAS values against a handheld calc (spot check).
-
Toggle Exclude rows with 0 cost and verify rows/aggregates update as expected.
Troubleshooting
-
Blank groups or “null” values: your dimension accessor is returning blank/“null”; map to the correct column or add a fallback.
-
ROAS/Revenue show $0: client may not have
platform_ecomm_revenue/platform_offline_revenueselected; either add them or remove those columns. -
CPM/CPC/CTR look off: check that base fields are numeric and not strings; confirm the client’s cost field name.
-
Table cramped: widen the container or adjust
autoSizeStrategyanddefaultMinWidth.
function PivotTable({ data = [], comparisonData = [] }) {
  const { useState, useMemo, useRef } = React;

  // ---------- helpers & dimension options ----------
  const pick = (row, fields) => {
    for (const f of fields) {
      const v = row && row[f];
      if (v !== undefined && v !== null && String(v).trim() !== '') return v;
    }
    return null;
  };

  const DIM_OPTIONS = [
    { key: 'channel',              label: 'Channel',              accessor: (r) => pick(r, ['channel','Channel']) },
    { key: 'platform',             label: 'Platform',             accessor: (r) => pick(r, ['platform','Platform']) },
    { key: 'market',               label: 'Market',               accessor: (r) => pick(r, ['market','Market']) },
    { key: 'funnel',               label: 'Funnel',               accessor: (r) => pick(r, ['funnel','Funnel']) },
    { key: 'tactic',               label: 'Tactic',               accessor: (r) => pick(r, ['tactic','Tactic']) },
    { key: 'objective',            label: 'Objective',            accessor: (r) => pick(r, ['objective','Objective']) },
    { key: 'client_initiative',  label: 'Client Initiative',  accessor: (i) => pick(i, ['client_initiative', 'Client Initiative']) },
    { key: 'business_category',    label: 'Business Category',    accessor: (r) => pick(r, ['business_category','Business Category','businessCategory','business category']) },
    { key: 'product_category',     label: 'Product Category',     accessor: (r) => pick(r, ['product_category','Product Category','productCategory','product category']) },
    { key: 'audience',             label: 'Audience',             accessor: (r) => pick(r, ['audience','Audience']) },
    { key: 'creative_message',     label: 'Creative Message',     accessor: (r) => pick(r, ['creative_message','Creative Message','creativeMessage','creative message']) },
    { key: 'creative_description', label: 'Creative Description', accessor: (r) => pick(r, ['creative_description','Creative Description','creativeDescription','creative description']) },
    { key: 'campaign_name',        label: 'Campaign Name',        accessor: (r) => pick(r, ['campaign_name','Campaign Name']) },
    { key: 'placement_name',       label: 'Placement Name',       accessor: (r) => pick(r, ['placement_name','Placement Name']) },
  ];
  const NONE_OPT = { key: 'none', label: '— None —', accessor: () => null };
  const byKey = Object.fromEntries([...DIM_OPTIONS, NONE_OPT].map(d => [d.key, d]));

  // ---------- UI state ----------
  const [dim1, setDim1] = useState('channel'); // default as requested
  const [dim2, setDim2] = useState('none');
  const [dim3, setDim3] = useState('none');

  // ---------- aggregate ----------
  const { dataArray, selectedDims } = useMemo(() => {
    const activeDims = [dim1, dim2, dim3].filter(k => k !== 'none');
    const grouped = {};
    data.forEach(row => {
      const keys = activeDims.map(k => {
        const v = byKey[k].accessor(row);
        return (v == null ? '' : String(v)).trim();
      });
      if (keys.some(k => !k || k.toLowerCase() === 'null')) return;
      const gk = keys.join('|');
      if (!grouped[gk]) {
        grouped[gk] = {};
        activeDims.forEach((k, i) => { grouped[gk][k] = keys[i]; });
      }
      Object.entries(row).forEach(([metric, val]) => {
        if (activeDims.includes(metric)) return;
        if (typeof val === 'number') grouped[gk][metric] = (grouped[gk][metric] || 0) + val;
      });
    });
    return { dataArray: Object.values(grouped), selectedDims: activeDims };
  }, [data, dim1, dim2, dim3]);

  // ---------- ag-Grid config (unchanged logic) ----------
  const headerClass = 'ag-center-header';
  const gridRef = useRef(null);
  const onGridReady = (p) => { if (gridRef) gridRef.current = p.api; };

  const autoSizeStrategy = { type: 'fitGridWidth', defaultMinWidth: 200 };
  const defaultColDef = {
    flex: 1, minWidth: 150, sortable: true, filter: true, resizable: true,
    menuTabs: ['generalMenuTab','columnsMenuTab','filterMenuTab'],
    suppressHeaderMenuButton: true,
  };

  const calculatedMetrics = ['cpm','cpc','ctr','ecomm_roas','omni_roas'];
  const defaultMetrics = ['cost','impressions','cpm','clicks','cpc','ctr','omni_revenue','omni_roas','platform_ecomm_revenue','ecomm_roas'];

  const calculatedColumnsValGetter = {
    cpm: p => p.node.group ? 0 : ({ cost:p.data.cost||0, impressions:p.data.impressions||0, cpm:(p.data.impressions||0)>0?(p.data.cost*1000)/p.data.impressions:0 }),
    cpc: p => p.node.group ? 0 : ({ cost:p.data.cost||0, clicks:p.data.clicks||0, cpc:(p.data.clicks||0)>0?p.data.cost/p.data.clicks:0 }),
    ctr: p => p.node.group ? 0 : ({ clicks:p.data.clicks||0, impressions:p.data.impressions||0, ctr:(p.data.impressions||0)>0?p.data.clicks/p.data.impressions:0 }),
    ecomm_roas: p => p.node.group ? 0 : ({ revenue:p.data.platform_ecomm_revenue||0, cost:p.data.cost||0, ecomm_roas:(p.data.cost||0)>0?(p.data.platform_ecomm_revenue||0)/p.data.cost:0 }),
    omni_roas: p => {
      if (p.node.group) return 0;
      const e=p.data.platform_ecomm_revenue||0, o=p.data.platform_offline_revenue||0, c=p.data.cost||0, omni=e+o;
      return { omni_rev:omni, cost:c, omni_roas:c>0?omni/c:0 };
    },
  };
  const calculatedColumnsAgg = {
    cpm: p => { let cost=0, imps=0; p.values.forEach(v=>{ if(v&&typeof v==='object'){ cost+=v.cost||0; imps+=v.impressions||0; }}); return { cost, impressions:imps, cpm: imps>0?(cost*1000)/imps:0 }; },
    cpc: p => { let cost=0, clicks=0; p.values.forEach(v=>{ if(v&&typeof v==='object'){ cost+=v.cost||0; clicks+=v.clicks||0; }}); return { cost, clicks, cpc: clicks>0?cost/clicks:0 }; },
    ctr: p => { let clicks=0, imps=0; p.values.forEach(v=>{ if(v&&typeof v==='object'){ clicks+=v.clicks||0; imps+=v.impressions||0; }}); return { clicks, impressions:imps, ctr: imps>0?clicks/imps:0 }; },
    ecomm_roas: p => { let rev=0, cost=0; p.values.forEach(v=>{ if(v&&typeof v==='object'){ rev+=v.revenue||0; cost+=v.cost||0; }}); return { revenue:rev, cost, ecomm_roas: cost>0?rev/cost:0 }; },
    omni_roas: p => { let omni=0, cost=0; p.values.forEach(v=>{ if(v&&typeof v==='object'){ omni+=v.omni_rev||0; cost+=v.cost||0; }}); return { omni_rev:omni, cost, omni_roas: cost>0?omni/cost:0 }; },
  };

  const formatCurrencyWhole = v => isNaN(parseFloat(v)) ? v : '$' + Math.round(parseFloat(v)).toLocaleString();
  const formatCurrency2    = v => isNaN(parseFloat(v)) ? v : '$' + parseFloat(v).toLocaleString(undefined,{minimumFractionDigits:2,maximumFractionDigits:2});
  const formatNumber       = v => isNaN(parseFloat(v)) ? v : parseFloat(v).toLocaleString(undefined,{maximumFractionDigits:2});
  const formatPercent      = v => isNaN(parseFloat(v)) ? v : (parseFloat(v)*100).toLocaleString(undefined,{maximumFractionDigits:2}) + '%';
  const calculatedMetricFormatWrapper = (value, format, key) =>
    Object.keys(calculatedColumnsAgg).includes(key) ? format(Object.values(value)[2]) : format(value);

  const currencyWholeColumns = ['cost','omni_revenue','platform_ecomm_revenue'];
  const currency2Columns     = ['cpm','cpc','omni_roas','ecomm_roas'];
  const percentColumns       = ['ctr'];
  const numberColumns        = ['impressions','clicks'];

  const prettyHeader = (key) => {
    const map = { cpm:'CPM', cpc:'CPC', ctr:'CTR', omni_roas:'Omni ROAS', ecomm_roas:'Ecomm ROAS', omni_revenue:'Omni Revenue', platform_ecomm_revenue:'Ecomm Revenue' };
    if (map[key]) return map[key];
    return key.split('_').map(w => w[0].toUpperCase()+w.slice(1)).join(' ');
  };

  const columnDefs = [];
  selectedDims.forEach(key => {
    columnDefs.push({
      field: key,
      headerName: DIM_OPTIONS.find(d => d.key === key)?.label || prettyHeader(key),
      rowGroup: true, hide: false, enableRowGroup: true, pinned: 'left', filter: true, sortable: true
    });
  });
  ['cost','impressions','cpm','clicks','cpc','ctr','omni_revenue','omni_roas','platform_ecomm_revenue','ecomm_roas'].forEach(key => {
    let base;
    if (key === 'omni_revenue') {
      base = {
        headerName: prettyHeader(key), headerClass: headerClass, sortable: true, filter: false,
        enableRowGroup: true, enableValue: true,
        valueGetter: p => (p.node.group || !p.data) ? 0 : (p.data.platform_ecomm_revenue||0) + (p.data.platform_offline_revenue||0),
        aggFunc: 'sum', hide: false, valueFormatter: p => formatCurrencyWhole(p.value)
      };
    } else if (!Object.keys(calculatedColumnsAgg).includes(key)) {
      base = { field: key, aggFunc: 'sum', headerName: prettyHeader(key), headerClass: headerClass, sortable: true, filter: false, enableRowGroup: true, enableValue: true, hide: false };
    } else {
      base = { headerName: prettyHeader(key), headerClass: headerClass, sortable: true, filter: false, enableRowGroup: false, enableValue: false, valueGetter: p => calculatedColumnsValGetter[key](p), aggFunc: p => calculatedColumnsAgg[key](p), hide: false };
    }
    if (currencyWholeColumns.includes(key))      base.valueFormatter = p => calculatedMetricFormatWrapper(p.value, formatCurrencyWhole, key);
    else if (currency2Columns.includes(key))     base.valueFormatter = p => calculatedMetricFormatWrapper(p.value, formatCurrency2, key);
    else if (numberColumns.includes(key))        base.valueFormatter = p => calculatedMetricFormatWrapper(p.value, formatNumber, key);
    else if (percentColumns.includes(key))       base.valueFormatter = p => calculatedMetricFormatWrapper(p.value, formatPercent, key);
    columnDefs.push(base);
  });

  const autoGroupColumnDef = {
    minWidth: 200,
    cellRendererParams: {
      suppressCount: true,
      totalValueGetter: (p) => (p.node.level === -1 ? 'Total' : '')
    },
  };

  // ---------- filter toggle ----------
  const [excludeZeroCost, setExcludeZeroCost] = useState(false);
  const filteredRowData = useMemo(
    () => (excludeZeroCost ? dataArray.filter(r => (r.cost || 0) > 0) : dataArray),
    [excludeZeroCost, dataArray]
  );

  // ---------- controls CSS with padding + right offset ----------
  const controlsCss = `
    .pivot-controls { display:flex; align-items:center; gap:16px; padding:12px 16px 0 16px; margin-bottom:8px; flex-wrap:wrap; }
    .control-group { display:flex; align-items:center; gap:6px; }
    .pivot-label { font-size:12px; color:#6B7280; }
    .pivot-select { font-family:'Work Sans'; font-size:12px; padding:6px 8px; border:1px solid #E5E7EB; border-radius:8px; background:#fff; width:200px; }
    .toggle-row { margin-left:auto; padding-right:32px; display:flex; align-items:center; gap:8px; } /* extra right space for the menu button */
    .toggle { position:relative; width:44px; height:24px; border-radius:999px; background:#D1D5DB; cursor:pointer; transition:background .2s; }
    .toggle.on { background:#34D399; }
    .knob { position:absolute; top:2px; left:2px; width:20px; height:20px; border-radius:50%; background:#fff; transition:left .2s; box-shadow:0 1px 2px rgba(0,0,0,.15); }
    .toggle.on .knob { left:22px; }
    .toggle-label { user-select:none; font-size:14px; }
  `;

  return React.createElement(
    'div',
    { style: { width: '100%' } },
    React.createElement('style', {}, controlsCss),

    // Controls row with padding like chart headers
    React.createElement('div', { className: 'pivot-controls' },
      React.createElement('div', { className: 'control-group' },
        React.createElement('span', { className: 'pivot-label' }, 'Dimension 1:'),
        React.createElement('select', { className: 'pivot-select', value: dim1, onChange: e => setDim1(e.target.value) },
          DIM_OPTIONS.map(o => React.createElement('option', { key: o.key, value: o.key }, o.label))
        )
      ),
      React.createElement('div', { className: 'control-group' },
        React.createElement('span', { className: 'pivot-label' }, 'Dimension 2:'),
        React.createElement('select', { className: 'pivot-select', value: dim2, onChange: e => setDim2(e.target.value) },
          [NONE_OPT, ...DIM_OPTIONS].map(o => React.createElement('option', { key: o.key, value: o.key }, o.label))
        )
      ),
      React.createElement('div', { className: 'control-group' },
        React.createElement('span', { className: 'pivot-label' }, 'Dimension 3:'),
        React.createElement('select', { className: 'pivot-select', value: dim3, onChange: e => setDim3(e.target.value) },
          [NONE_OPT, ...DIM_OPTIONS].map(o => React.createElement('option', { key: o.key, value: o.key }, o.label))
        )
      ),
      React.createElement('div', { className: 'toggle-row' },
        React.createElement('div', {
          className: `toggle ${excludeZeroCost ? 'on' : ''}`,
          role: 'switch', 'aria-checked': excludeZeroCost, tabIndex: 0,
          onClick: () => setExcludeZeroCost(v => !v),
          onKeyDown: e => { if (e.key === 'Enter' || e.key === ' ') setExcludeZeroCost(v => !v); }
        }, React.createElement('div', { className: 'knob' })),
        React.createElement('span', { className: 'toggle-label' }, 'Exclude rows with 0 cost')
      )
    ),

    React.createElement('style', {}, `.ag-row-footer { background:#F9FAFC; }`),
    React.createElement('div', { style: { height: 500, width: '100%' } },
      React.createElement(AgGridReact, {
        rowData: filteredRowData,
        columnDefs,
        autoGroupColumnDef,
        grandTotalRow: true,
        animateRows: true,
        pivotMode: true,
        groupDisplayType: 'multipleColumns',
        theme: gridTheme,
        modules: [AllEnterpriseModule],
        defaultColDef,
        sideBar: false,
        autoSizeStrategy,
        suppressAggFuncInHeader: true,
        groupHideOpenParents: true,
        onGridReady,
        ref: gridRef
      })
    )
  );
}