
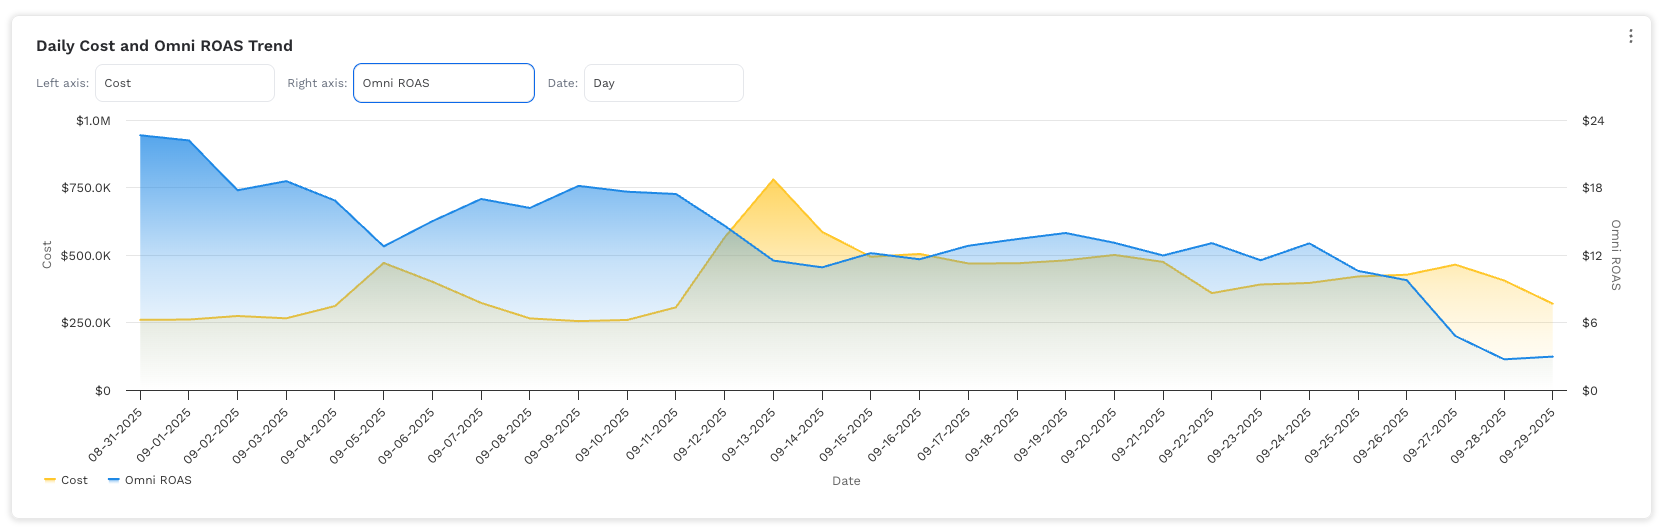
{Grain} {Left Metric} and {Right Metric} Trend.
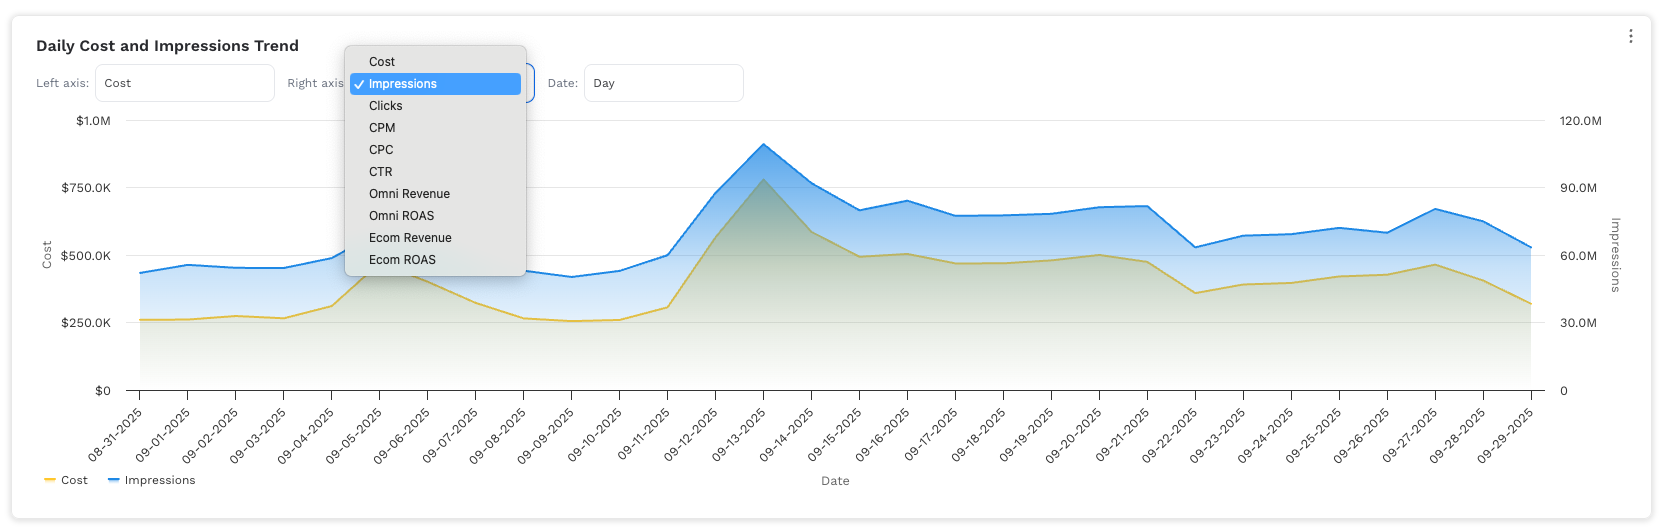
An overlapping area chart with a left y-axis for {Left Metric} and a right y-axis for {Right Metric}. The x-axis shows {grain: day/week/month/year}. Use the dropdowns to change metrics or grain.
Steps to create
-
Select a chart to replace
-
Open the dashboard and choose the visualization slot you want to replace.
-
Switch to Code View.
-
-
Select the necessary columns
-
At minimum you’ll need:
-
date(date field) -
Two or more metrics, recommended metrics:
-
cost -
revenue columns (e.g.,
platform_ecomm_revenue,platform_offline_revenue,platform_omni_revenue) -
impressions,clicks(if you want CTR, CPC, CPM available)
-
-
-
In the Michaels example, these columns were selected:
-
Calendardate,Cost,Platform Ecomm Revenue,Platform Omni Revenue, etc
-
-
-
Paste the code
-
Use the LineChart component (see code sample below).
-
The METRICS catalog defines all the possible dropdown options.
-
Update the
fn:accessors to point to your client’s column names. -
Example: Michaels has
platform_ecomm_revenue; if your client’s data usesecomm_revinstead, update the function accordingly.
-
-
Metrics typed as
'currency'will auto-format with$. Change to'number'or'percent'if needed.
-
-
Update the client-specific values
-
Column names: Verify your client’s schema. Update any fields in
METRICSaccordingly. -
Default selections:
-
Left axis default is
'cost'. -
Right axis default is
'omni_roas'. -
Date grain default is
'day'. -
Change these defaults if your client needs a different setup.
-
-
-
Save and preview
-
Click Save, then confirm the visualization renders correctly.
-
Use the dropdowns to confirm that metrics and date grains work.
-
Use ChatGPT to help update this code with your clients metrics
function LineChart({ data = [], comparisonData = [] }) {
  const { useState, useMemo } = React;

  // ==== Metric catalog ====
  // type: 'currency' | 'number' | 'percent'
  const METRICS = [
    { key: 'cost',        label: 'Cost',          type: 'currency', fn: d => d.cost },
    { key: 'impressions', label: 'Impressions',   type: 'number',   fn: d => d.impressions },
    { key: 'clicks',      label: 'Clicks',        type: 'number',   fn: d => d.clicks },
    { key: 'cpm',         label: 'CPM',           type: 'currency', fn: d => d.impressions ? (d.cost / d.impressions) * 1000 : 0 },
    { key: 'cpc',         label: 'CPC',           type: 'currency', fn: d => d.clicks ? (d.cost / d.clicks) : 0 },
    { key: 'ctr',         label: 'CTR',           type: 'percent',  fn: d => d.impressions ? (d.clicks / d.impressions) : 0 },
    { key: 'omni_rev',    label: 'Omni Revenue',  type: 'currency', fn: d => d.platform_omni_revenue },
    // ROAS = currency formatting
    { key: 'omni_roas',   label: 'Omni ROAS',     type: 'currency', fn: d => d.cost ? (d.platform_ecomm_revenue + d.platform_offline_revenue) / d.cost : 0 },
    { key: 'ecom_rev',    label: 'Ecom Revenue',  type: 'currency', fn: d => d.platform_ecomm_revenue },
    { key: 'ecom_roas',   label: 'Ecom ROAS',     type: 'currency', fn: d => d.cost ? d.platform_ecomm_revenue / d.cost : 0 },
  ];

  // Interval options (calendar)
  const DATE_GRAINS = [
    { key: 'day',   label: 'Day' },
    { key: 'week',  label: 'Week' },
    { key: 'month', label: 'Month' },
    { key: 'year',  label: 'Year' },
  ];

  const [leftKey, setLeftKey]     = useState('cost');
  const [rightKey, setRightKey]   = useState('omni_roas');
  const [dateGrain, setDateGrain] = useState('day');

  const leftMeta  = useMemo(() => METRICS.find(m => m.key === leftKey)  || METRICS[0], [leftKey]);
  const rightMeta = useMemo(() => METRICS.find(m => m.key === rightKey) || METRICS[7], [rightKey]);

  const grainWord = { day: 'Daily', week: 'Weekly', month: 'Monthly', year: 'Yearly' }[dateGrain] || 'Daily';
  const titleText = useMemo(() => {
    if (leftMeta.key === rightMeta.key) return `${grainWord} ${leftMeta.label} Trend`;
    return `${grainWord} ${leftMeta.label} and ${rightMeta.label} Trend`;
  }, [leftMeta, rightMeta, grainWord]);

  // ==== Helpers ====
  const toUTC = (mmddyyyy) => {
    const [m, d, y] = mmddyyyy.split('/').map(Number);
    return Date.UTC(y, m - 1, d);
  };
  const startOfISOWeek = (t) => {
    const d = new Date(t);
    const day = d.getUTCDay(); // 0=Sun..6=Sat
    const diff = (day + 6) % 7; // days since Monday
    return Date.UTC(d.getUTCFullYear(), d.getUTCMonth(), d.getUTCDate() - diff);
  };

  // ==== Daily aggregate ====
  const daily = useMemo(() => {
    const acc = {};
    data.forEach(item => {
      if (!item.calendardate) return;
      const t = toUTC(item.calendardate);
      if (!acc[t]) {
        acc[t] = {
          cost: 0, impressions: 0, clicks: 0,
          platform_ecomm_revenue: 0, platform_offline_revenue: 0, platform_omni_revenue: 0,
        };
      }
      acc[t].cost += Number(item.cost) || 0;
      acc[t].impressions += Number(item.impressions) || 0;
      acc[t].clicks += Number(item.clicks) || 0;
      acc[t].platform_ecomm_revenue += Number(item.platform_ecomm_revenue) || 0;
      acc[t].platform_offline_revenue += Number(item.platform_offline_revenue) || 0;
      acc[t].platform_omni_revenue += Number(item.platform_omni_revenue) || 0;
    });
    return Object.keys(acc).map(k => [Number(k), acc[Number(k)]])
      .sort((a, b) => a[0] - b[0]);
  }, [data]);

  // ==== Re-aggregate to selected interval (calendar) ====
  const bucketed = useMemo(() => {
    const map = new Map();

    const add = (key, d) => {
      if (!map.has(key)) {
        map.set(key, {
          cost: 0, impressions: 0, clicks: 0,
          platform_ecomm_revenue: 0, platform_offline_revenue: 0, platform_omni_revenue: 0,
        });
      }
      const a = map.get(key);
      a.cost += d.cost;
      a.impressions += d.impressions;
      a.clicks += d.clicks;
      a.platform_ecomm_revenue += d.platform_ecomm_revenue;
      a.platform_offline_revenue += d.platform_offline_revenue;
      a.platform_omni_revenue += d.platform_omni_revenue;
    };

    for (const [t, d] of daily) {
      let keyTs;
      if (dateGrain === 'day')       keyTs = t;
      else if (dateGrain === 'week') keyTs = startOfISOWeek(t);
      else if (dateGrain === 'month') keyTs = Date.UTC(new Date(t).getUTCFullYear(), new Date(t).getUTCMonth(), 1);
      else if (dateGrain === 'year')  keyTs = Date.UTC(new Date(t).getUTCFullYear(), 0, 1);
      else keyTs = t;
      add(keyTs, d);
    }

    return Array.from(map.entries())
      .map(([ts, v]) => [Number(ts), v])
      .sort((a, b) => a[0] - b[0]);
  }, [daily, dateGrain]);

  // Build series for selected metrics
  const leftSeriesData  = useMemo(() => bucketed.map(([t, d]) => [t, METRICS.find(m => m.key === leftKey).fn(d)]), [bucketed, leftKey]);
  const rightSeriesData = useMemo(() => bucketed.map(([t, d]) => [t, METRICS.find(m => m.key === rightKey).fn(d)]), [bucketed, rightKey]);

  // ==== Formatting ====
  const abbrev = (val) => {
    const abs = Math.abs(val);
    if (abs >= 1_000_000_000) return (val / 1_000_000_000).toFixed(1) + 'B';
    if (abs >= 1_000_000)     return (val / 1_000_000).toFixed(1) + 'M';
    if (abs >= 1_000)         return (val / 1_000).toFixed(1) + 'K';
    return String(Math.round(val));
  };
  const formatAxis = (type, v) => {
    if (type === 'currency') return v >= 1000 ? '$' + abbrev(v) : '$' + Math.round(v);
    if (type === 'percent')  return (v * 100).toFixed(1) + '%';
    return abbrev(v);
  };
  const costColor = '#FFC72C';
  const altColor  = '#1E88E5';

  const xLabelFmt = ({
    day:   '{value:%m-%d-%Y}',
    week:  '{value:%m-%d-%Y}',     // Monday of the week
    month: '{value:%b %Y}',
    year:  '{value:%Y}',
  })[dateGrain] || '{value:%m-%d-%Y}';

  const options = {
    chart: {
      type: 'area',
      marginTop: 10,
      marginBottom: 120,
      spacing: [8, 16, 16, 16],
      style: { fontFamily: 'Work Sans' },
      styledMode: false
    },
    title: { text: null },
    subtitle: { text: null },
    legend: {
      align: 'left',
      verticalAlign: 'bottom',
      layout: 'horizontal',
      itemStyle: { fontSize: '12px' },
      symbolHeight: 12,
      symbolWidth: 12,
      x: 0, y: 0, maxHeight: 60
    },
    xAxis: {
      title: { text: 'Date' },
      type: 'datetime',
      tickmarkPlacement: 'on',
      labels: { format: xLabelFmt },
      tickPixelInterval: 20,
      crosshair: { color: 'black', width: 1, dashStyle: 'Solid' }
    },
    yAxis: [
      { title: { text: leftMeta.label },  labels: { formatter: function () { return formatAxis(leftMeta.type, this.value); } } },
      { title: { text: rightMeta.label }, labels: { formatter: function () { return formatAxis(rightMeta.type, this.value); } }, opposite: true }
    ],
    tooltip: {
      shared: true,
      useHTML: true,
      backgroundColor: '#292A2EE5',
      borderRadius: 8,
      padding: 12,
      style: { color: '#FFFFFF', lineHeight: '20px' },
      formatter: function () {
        const fmt = (meta, v) => {
          if (meta.type === 'currency') {
            const abs = Math.abs(v);
            if (abs >= 1_000_000_000) return '$' + (v / 1_000_000_000).toFixed(1) + 'B';
            if (abs >= 1_000_000)     return '$' + (v / 1_000_000).toFixed(1) + 'M';
            if (abs >= 1_000)         return '$' + (v / 1_000).toFixed(1) + 'K';
            return '$' + v.toFixed(2);
          }
          if (meta.type === 'percent') return (v * 100).toFixed(2) + '%';
          const abs = Math.abs(v);
          if (abs >= 1_000_000_000) return (v / 1_000_000_000).toFixed(1) + 'B';
          if (abs >= 1_000_000)     return (v / 1_000_000).toFixed(1) + 'M';
          if (abs >= 1_000)         return (v / 1_000).toFixed(1) + 'K';
          return v.toFixed(2);
        };
        const dateLabel = Highcharts.dateFormat('%m-%d-%Y', this.x);
        const pts = this.points.map(p => {
          const meta = p.series.userOptions.__meta;
          return `<span style="display:inline-block;vertical-align:middle;width:0.7rem;height:0.7rem;border-radius:50%;background-color:${p.color};margin-right:3px;"></span>
                  <span style="vertical-align:middle;font-size:12px">${p.series.name}: ${fmt(meta, p.y)}</span>`;
        }).join('<br/>');
        return `<span style="font-size:12px;display:block;margin-bottom:4px;">${dateLabel}</span>${pts}`;
      }
    },
    plotOptions: {
      area: { stacking: null, marker: { enabled: false } },
      series: {
        marker: { enabled: true, symbol: 'circle', states: { hover: { enabled: true, radius: 6, lineWidth: 1 } } }
      }
    },
    series: [
      {
        name: leftMeta.label,
        __meta: leftMeta,
        data: leftSeriesData,
        yAxis: 0,
        color: costColor,
        fillColor: {
          linearGradient: { x1: 0, y1: 0, x2: 0, y2: 1 },
          stops: [
            [0, Highcharts.color(costColor).setOpacity(0.75).get('rgba')],
            [0.25, Highcharts.color(costColor).setOpacity(0.5).get('rgba')],
            [0.5, Highcharts.color(costColor).setOpacity(0.25).get('rgba')],
            [0.75, Highcharts.color(costColor).setOpacity(0.1).get('rgba')],
            [1, Highcharts.color(costColor).setOpacity(0).get('rgba')]
          ]
        }
      },
      {
        name: rightMeta.label,
        __meta: rightMeta,
        data: rightSeriesData,
        yAxis: 1,
        color: altColor,
        fillColor: {
          linearGradient: { x1: 0, y1: 0, x2: 0, y2: 1 },
          stops: [
            [0, Highcharts.color(altColor).setOpacity(0.75).get('rgba')],
            [0.25, Highcharts.color(altColor).setOpacity(0.5).get('rgba')],
            [0.5, Highcharts.color(altColor).setOpacity(0.25).get('rgba')],
            [0.75, Highcharts.color(altColor).setOpacity(0.1).get('rgba')],
            [1, Highcharts.color(altColor).setOpacity(0).get('rgba')]
          ]
        }
      }
    ],
    credits: { enabled: false }
  };

  // ===== Header (title + dropdowns; interval next to right-axis) =====
  return React.createElement('div', { style: { width: '100%' } },
    React.createElement('div', {
      style: { display: 'flex', flexDirection: 'column', gap: 8, marginBottom: 8, padding: '12px 16px 0 16px' }
    },
      React.createElement('div', { style: { fontFamily: 'Work Sans', fontWeight: 600, fontSize: 16, color: '#292A2E' } }, titleText),
      React.createElement('div', { style: { display: 'flex', gap: 12, alignItems: 'center', flexWrap: 'wrap' } },
        React.createElement('div', { style: { display: 'flex', alignItems: 'center', gap: 6 } },
          React.createElement('span', { style: { fontSize: 12, color: '#6B7280' } }, 'Left axis:'),
          React.createElement('select', {
            value: leftKey, 'aria-label': 'Left axis metric',
            onChange: (e) => setLeftKey(e.target.value),
            style: { fontFamily: 'Work Sans', fontSize: 12, padding: '6px 8px', borderRadius: 8, border: '1px solid #E5E7EB', background: '#fff', width: 180 }
          }, METRICS.map(m => React.createElement('option', { key: m.key, value: m.key }, m.label)))
        ),
        React.createElement('div', { style: { display: 'flex', alignItems: 'center', gap: 6 } },
          React.createElement('span', { style: { fontSize: 12, color: '#6B7280' } }, 'Right axis:'),
          React.createElement('select', {
            value: rightKey, 'aria-label': 'Right axis metric',
            onChange: (e) => setRightKey(e.target.value),
            style: { fontFamily: 'Work Sans', fontSize: 12, padding: '6px 8px', borderRadius: 8, border: '1px solid #E5E7EB', background: '#fff', width: 180 }
          }, METRICS.map(m => React.createElement('option', { key: m.key, value: m.key }, m.label))),
          React.createElement('span', { style: { fontSize: 12, color: '#6B7280', marginLeft: 8 } }, 'Date:'),
          React.createElement('select', {
            value: dateGrain, 'aria-label': 'Date interval',
            onChange: (e) => setDateGrain(e.target.value),
            style: { fontFamily: 'Work Sans', fontSize: 12, padding: '6px 8px', borderRadius: 8, border: '1px solid #E5E7EB', background: '#fff', width: 160 }
          }, DATE_GRAINS.map(g => React.createElement('option', { key: g.key, value: g.key }, g.label)))
        )
      )
    ),
    React.createElement(HighchartsReact, { highcharts: Highcharts, options })
  );
}