
Prerequisite
Before using Scenario Planner, ensure that all required revenue and spend data has been properly set up in Alli and that the model is fully configured and ready for use.
Sh
Step 1: Understand the Brand Demand and Revenue Graph
At the top of Scenario Planner, review the graph that compares your brand demand against your revenue.
-
The blue line represents brand equity, a composite signal of awareness and overall market interest.
-
The green line represents revenue tracked within Alli.
If your revenue line appears incorrect, contact the Alli team so they can verify and correct the backend revenue integration.
What the Trends Mean
If the blue line (brand demand) begins to decline, it can act as an early signal of potential revenue impact in the future. A sustained drop in brand demand may indicate weakening market interest, which can later translate into slower revenue growth.
Monitoring the relationship between these two lines helps you identify imbalance early and adjust allocations before revenue is affected.
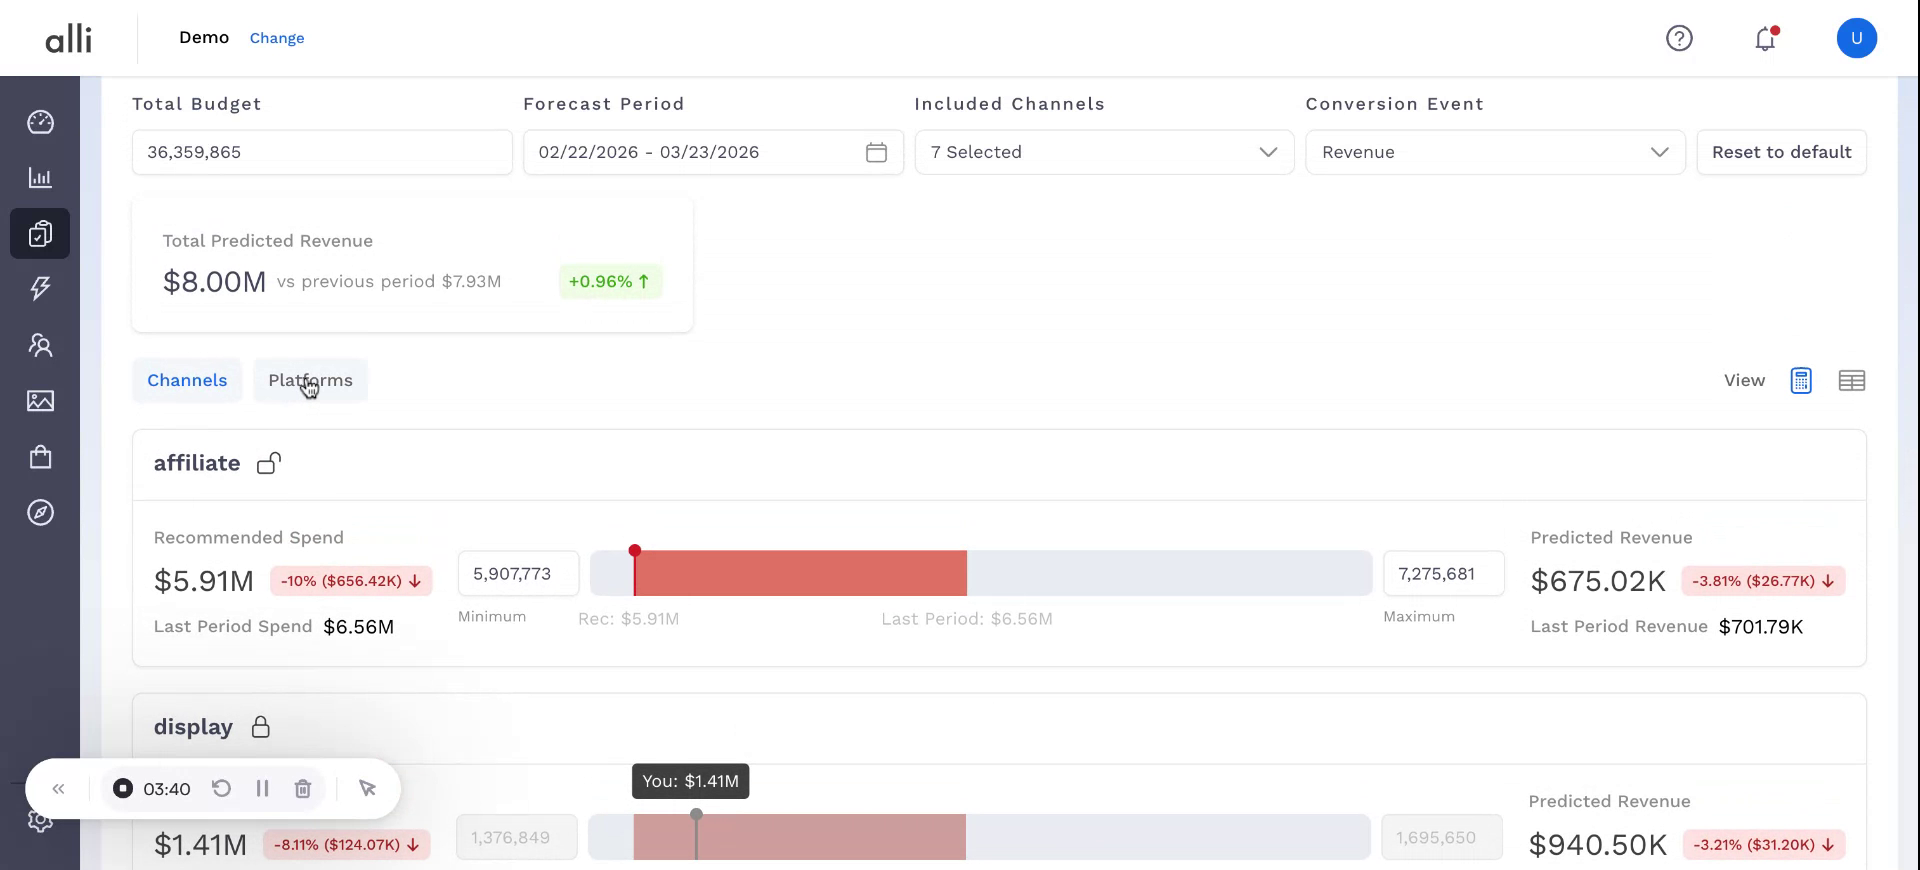
Step 2: Review and Adjust the Total Budget Recommendations
Scenario Planner generates recommendations based on the channels you currently spend on and assumes your total budget is the same as last month.
-
If your total budget has changed, update the total budget value in the tool.
-
The predictions and recommendations will automatically adjust to reflect the new total budget.
By default, the tool recommends reallocations within ±10% for each channel. This can be modified if you have a higher or lower risk appetite for specific channels.
Step 3: Customize Channel Bounds for More Aggressive Recommendations
If you want the tool to explore more aggressive investment levels in a particular channel, adjust that channel’s bounds.
Example: if you can spend more on Out Of Home (ooh) in screen below, increase the upper bound for that channel so the model can consider higher allocations.
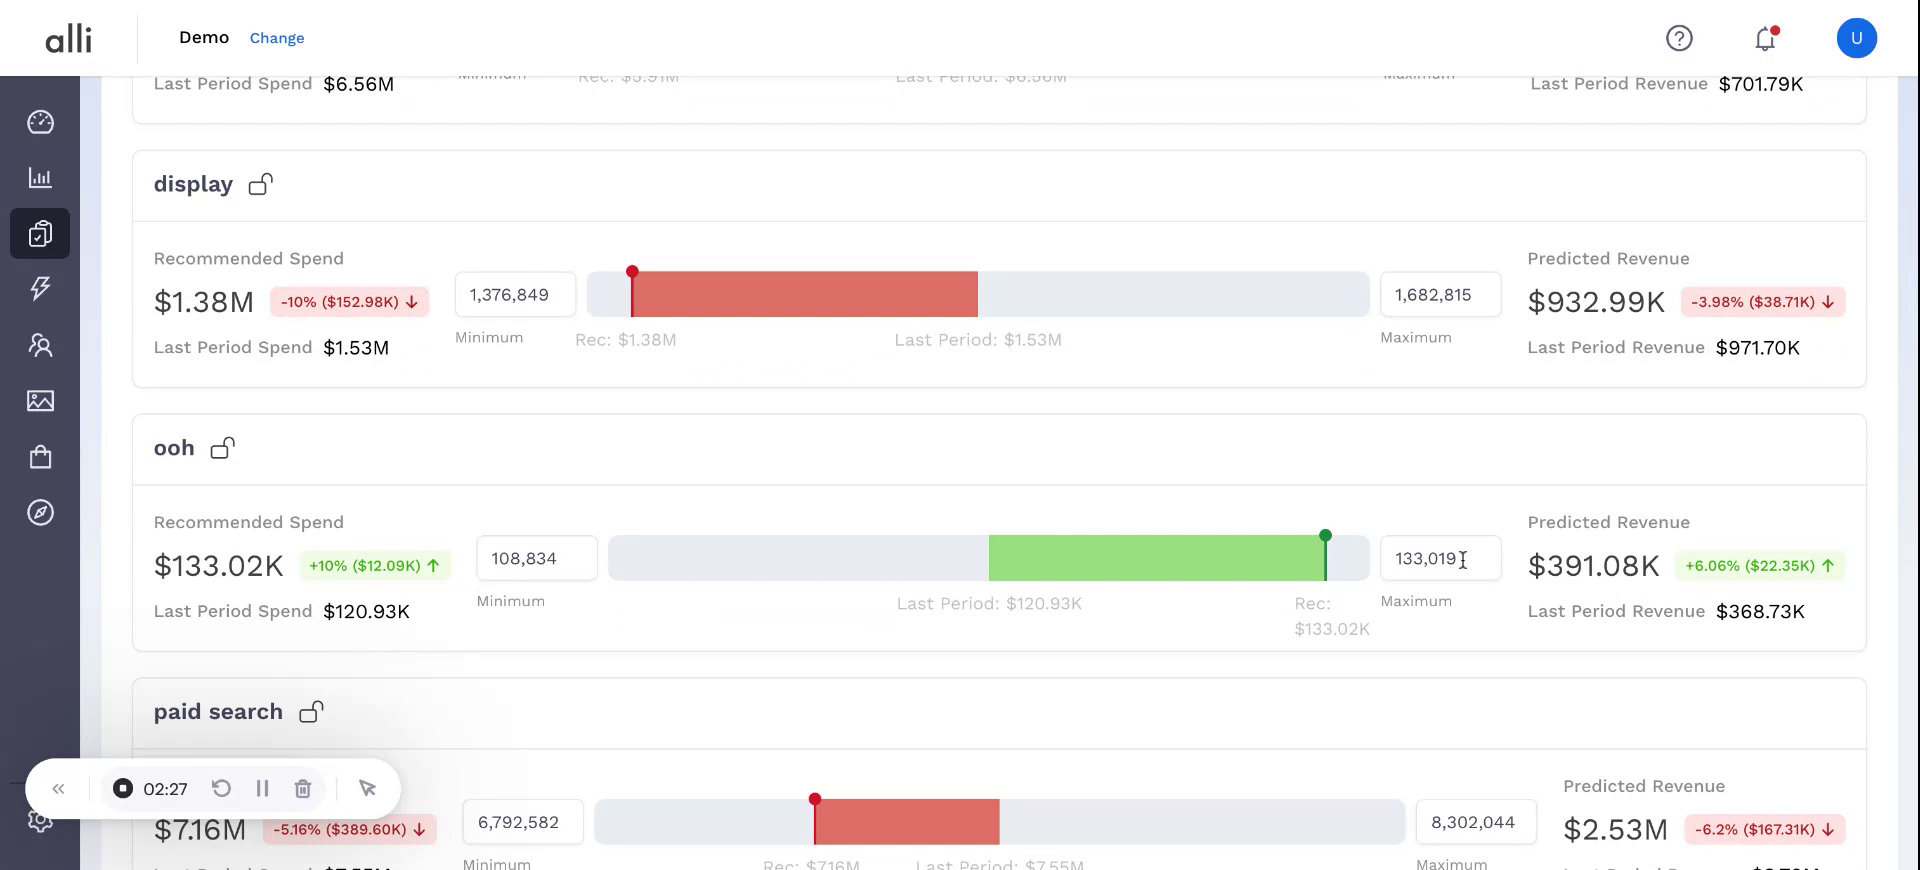
NOTE: The optimizer may still choose not to use the entire available amount (for instance, using 167K of a possible 200K) because it always optimizes for maximum efficiency, not simply maximum spend.
Step 4: Apply Channel-Level Spend Constraints
Scenario Planner can respect minimum or fixed spend constraints at the channel level.
-
For example, if you must spend at least 1.4M on Display, enter this value and the system automatically locks the value.
-
The tool will then keep this constraint fixed while still optimizing the rest of the budget for maximum efficiency.
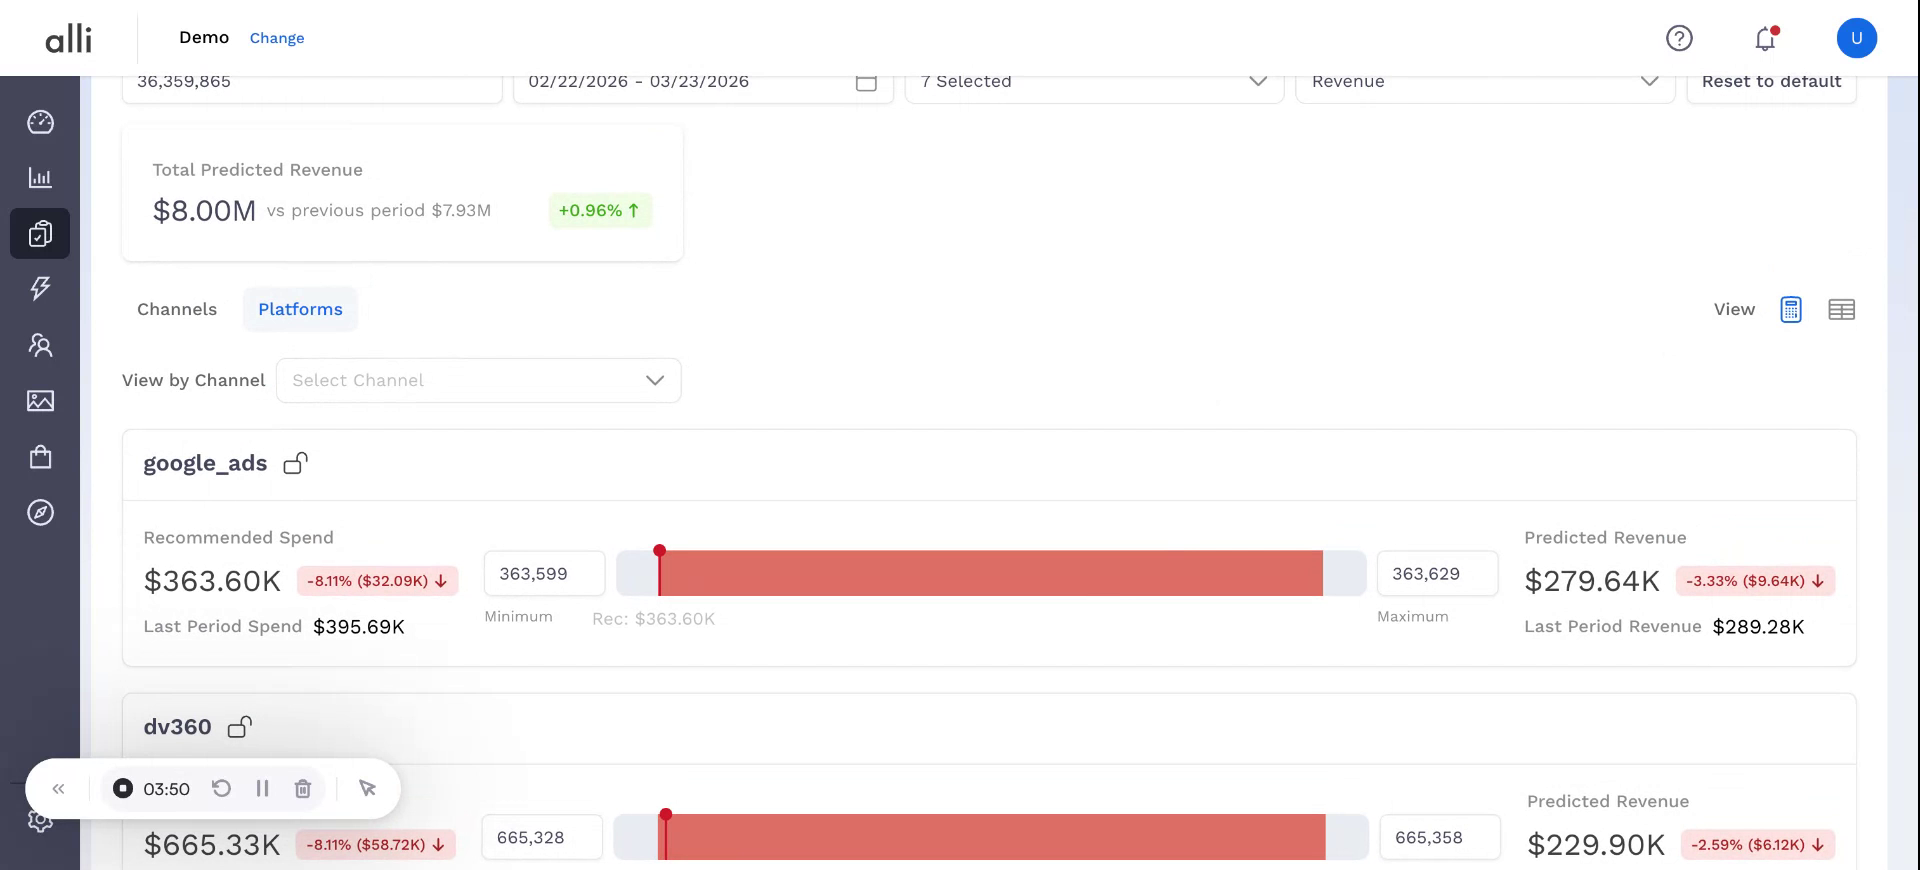
Step 5: Drill Down into Platform-Level Recommendations
To see how recommended spend is distributed within a channel, drill down to the platform level.
This view allows you to understand the specific platform recommendations that roll up into each channel’s total allocation.
Step 6: Switch from Calculator View to Tabular View
If you prefer a more structured layout, switch from the calculator-style interface to the tabular view.
The tabular view provides an overall summary of recommended spend across channels and platforms in a grid format, making it easier to compare and edit values.
Step 7: Editable Tabular view
Use the tabular view to directly edit or lock spend values:
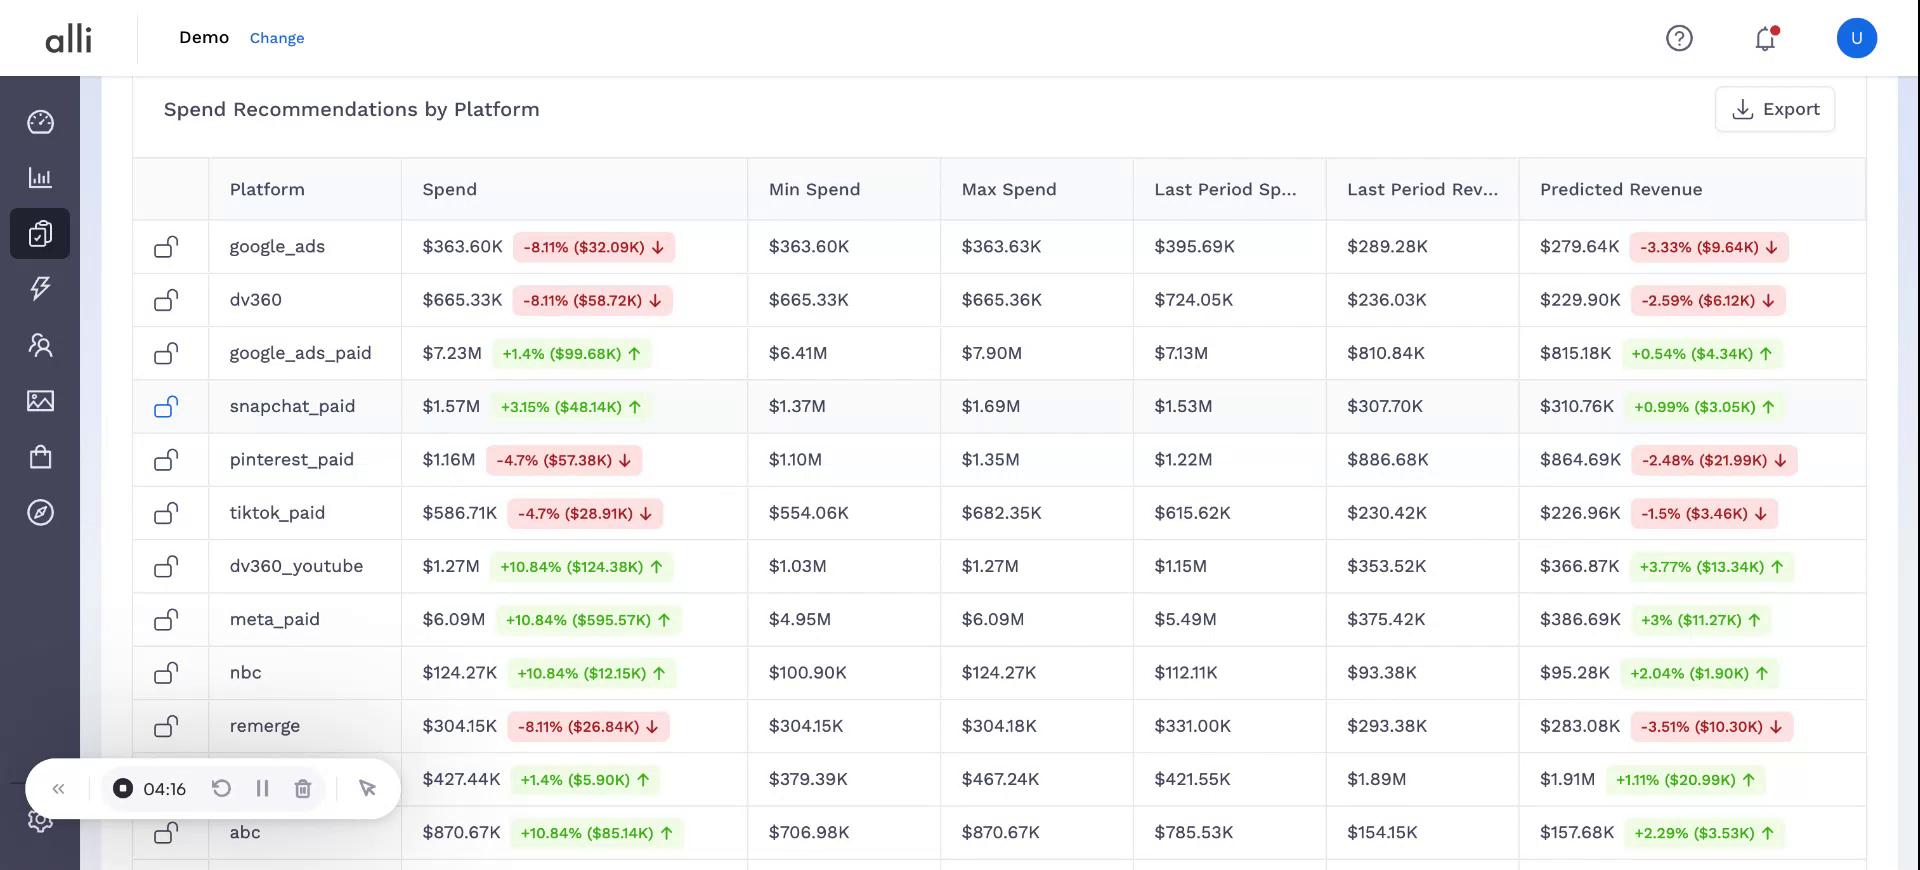
-
Adjust spend for any specific platform or channel if you want to test alternative allocations.
-
Lock values where you have firm commitments or constraints.
Scenario Planner will respect these edits and constraints while recalculating the remaining allocations for efficiency.
Step 8: Export the Plan for Use in Your Existing Spreadsheets
Once you are satisfied with the recommendations and any manual adjustments:
-
Use the export option to download the current view.
-
Import this file into your existing planning spreadsheets or reporting tools to incorporate Scenario Planner’s recommendations into your broader planning process.