
Overview
The Compare Date Ranges feature in Explorer allows you to evaluate performance over time by directly comparing two time periods side by side. Whether you're measuring week-over-week results or year-over-year growth, this feature helps surface meaningful trends quickly — across both charts and tables.
Use it to answer questions like:
-
How did impressions change from last week to this week?
-
What’s our click-through rate compared to the same time last year?
-
Are we pacing ahead or behind recent periods?
You can also use Ask Alli to compare performance across time periods. Just ask something like:
“Show me impressions by channel for the last 30 days compared to the previous 30 days.”
Ask Alli will generate the chart and table instantly — no manual setup required.
Instructions
-
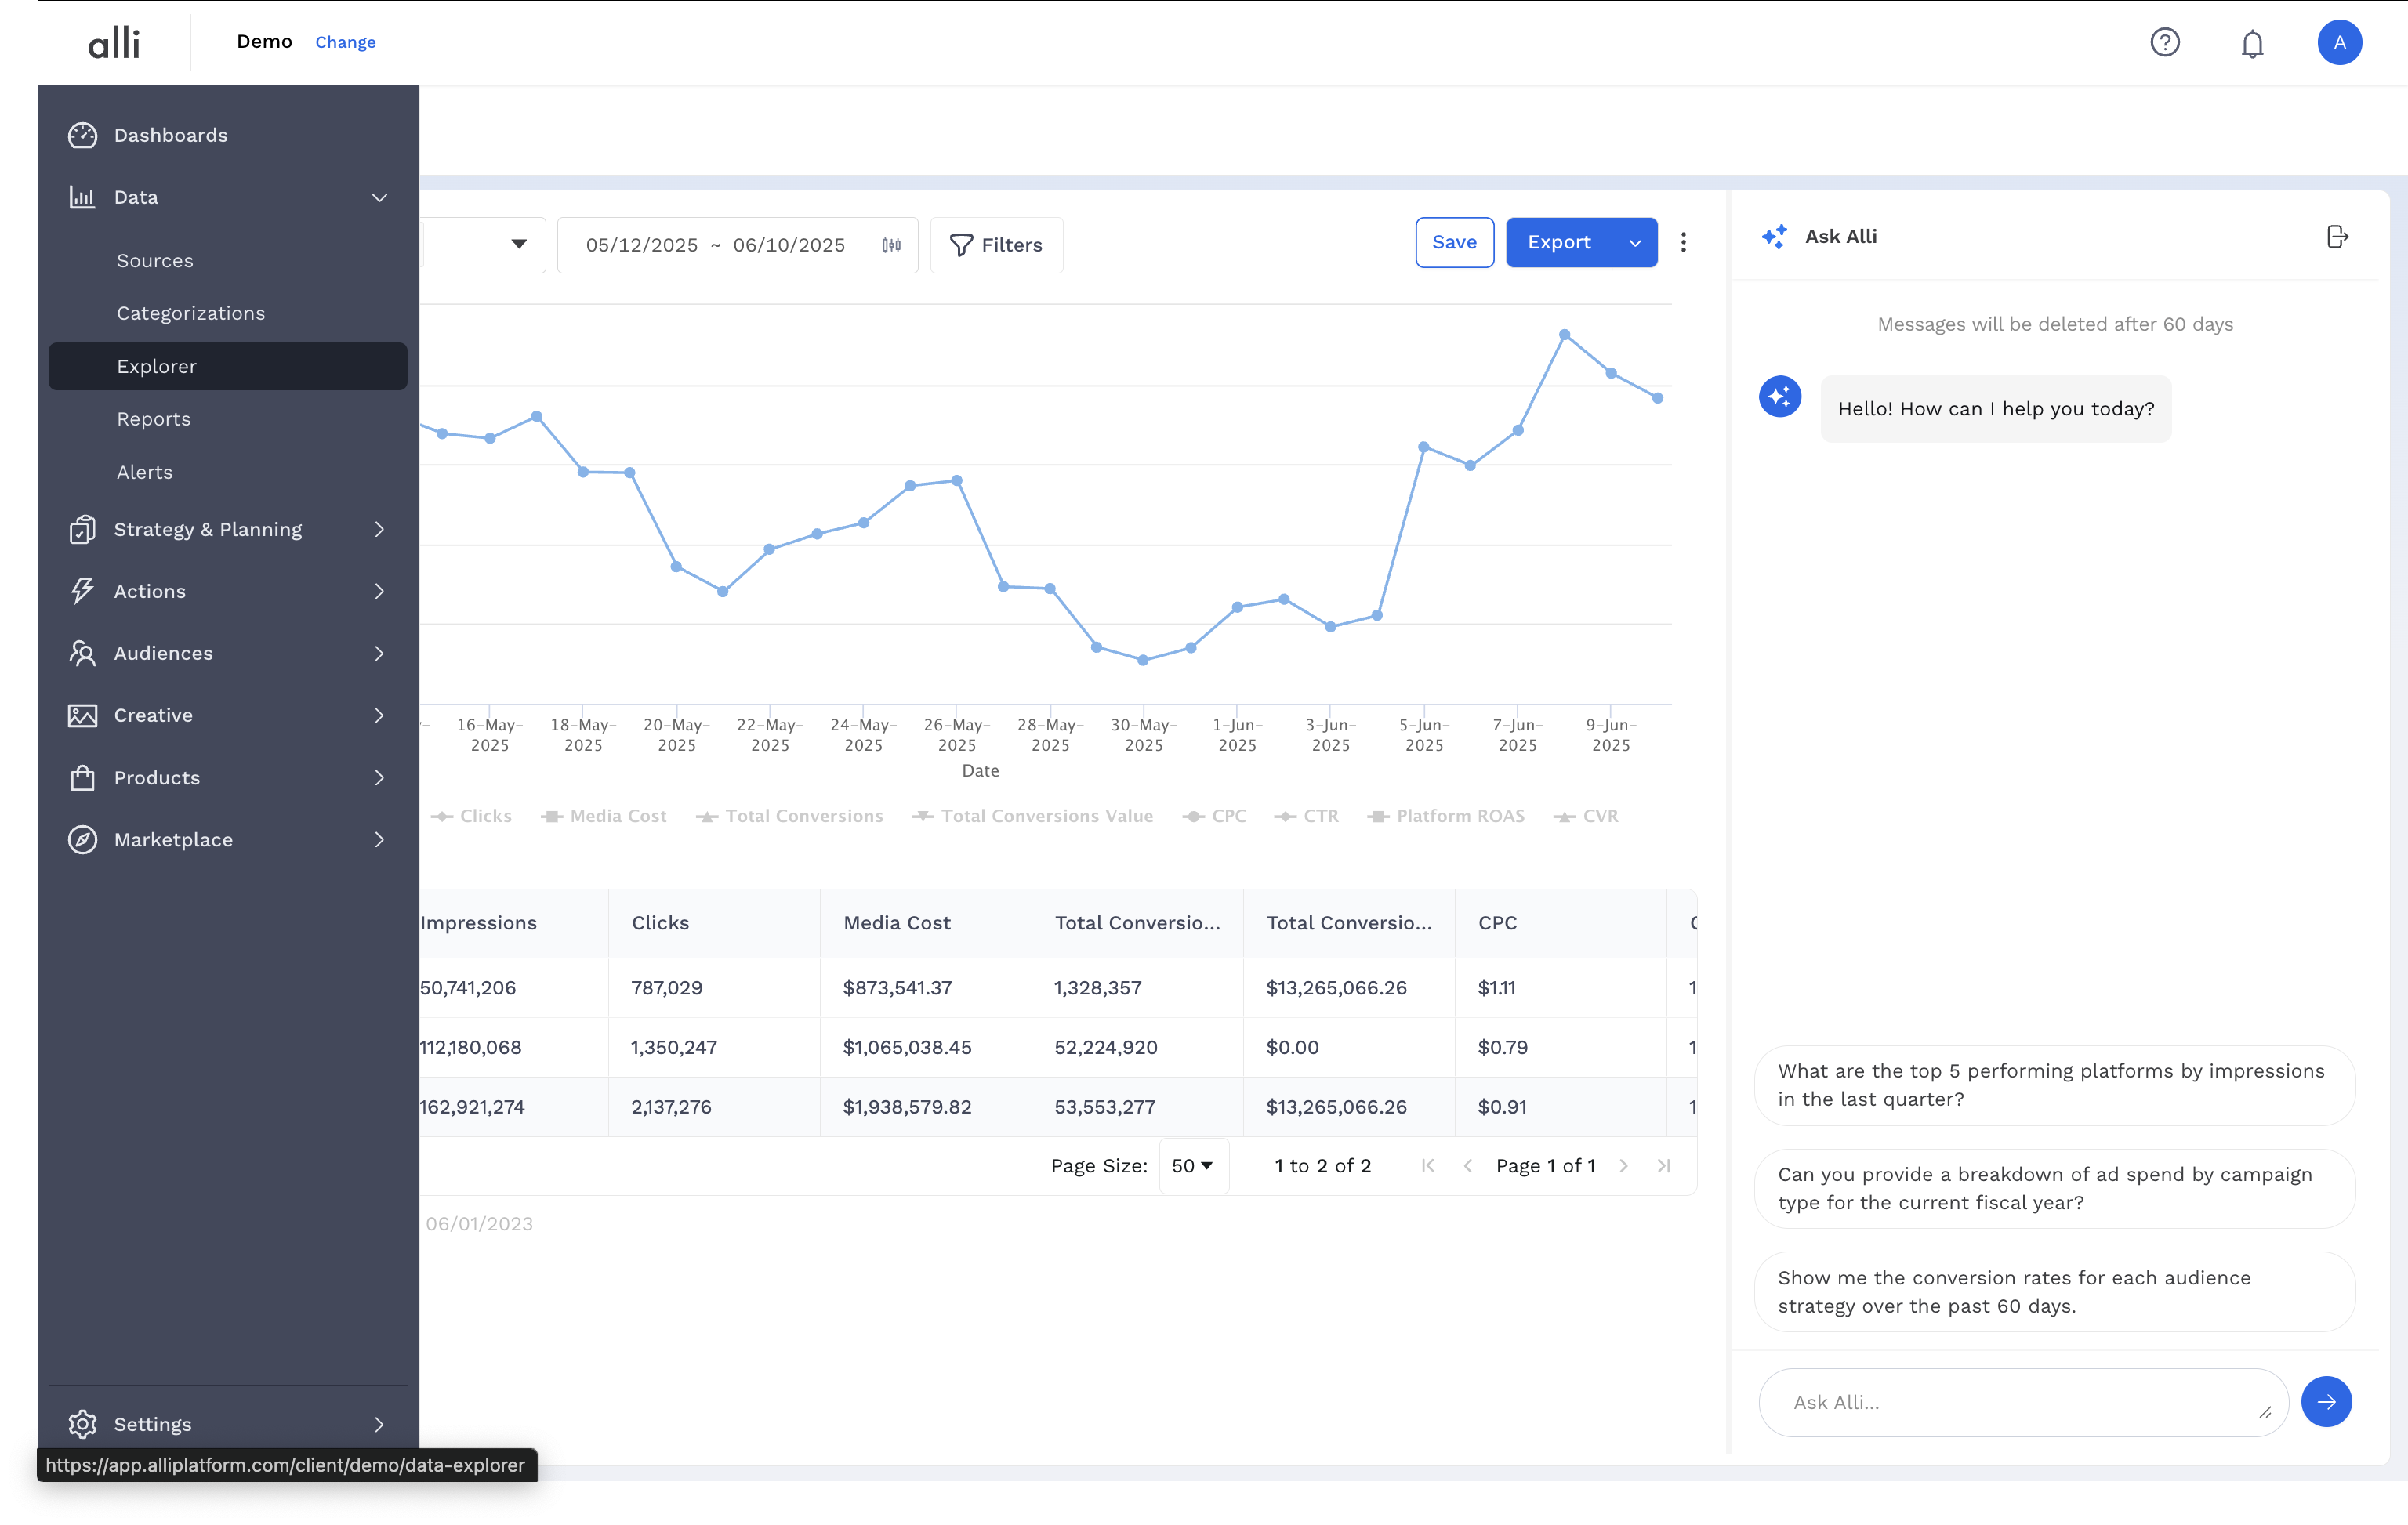
Navigate to the Explorer section in the left navigation panel.
-
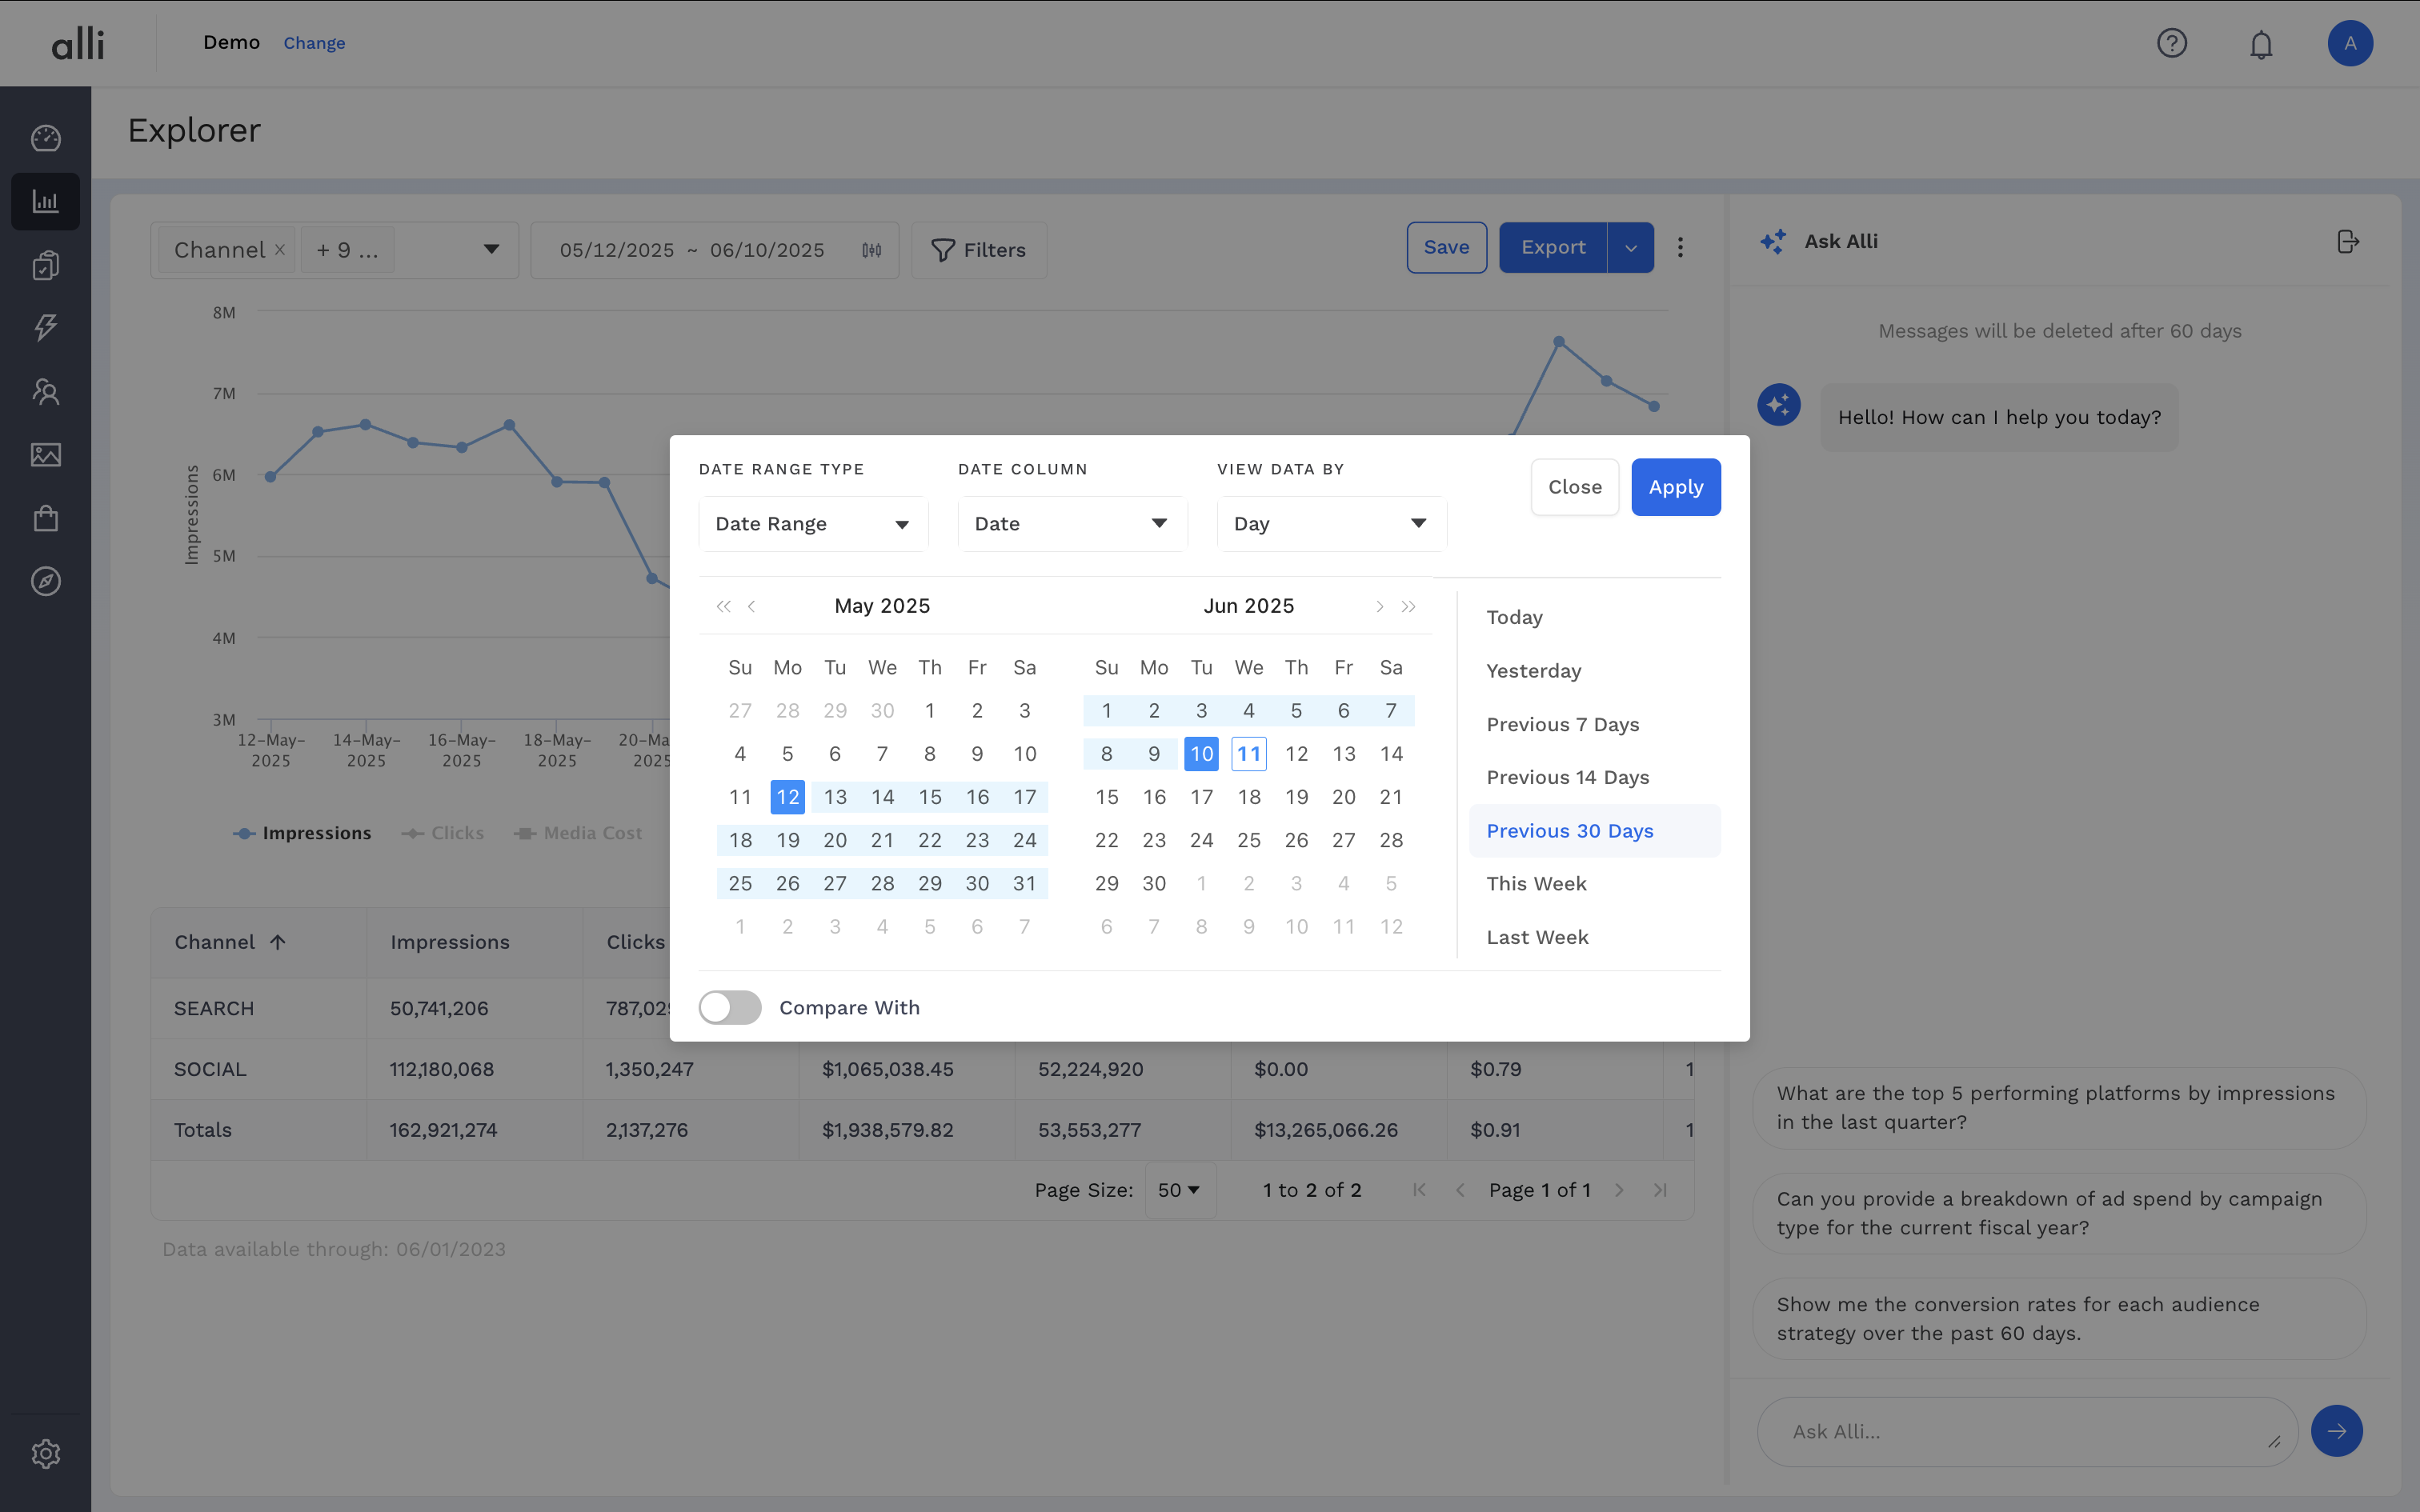
Use the calendar or preset options to choose your main date range.
-
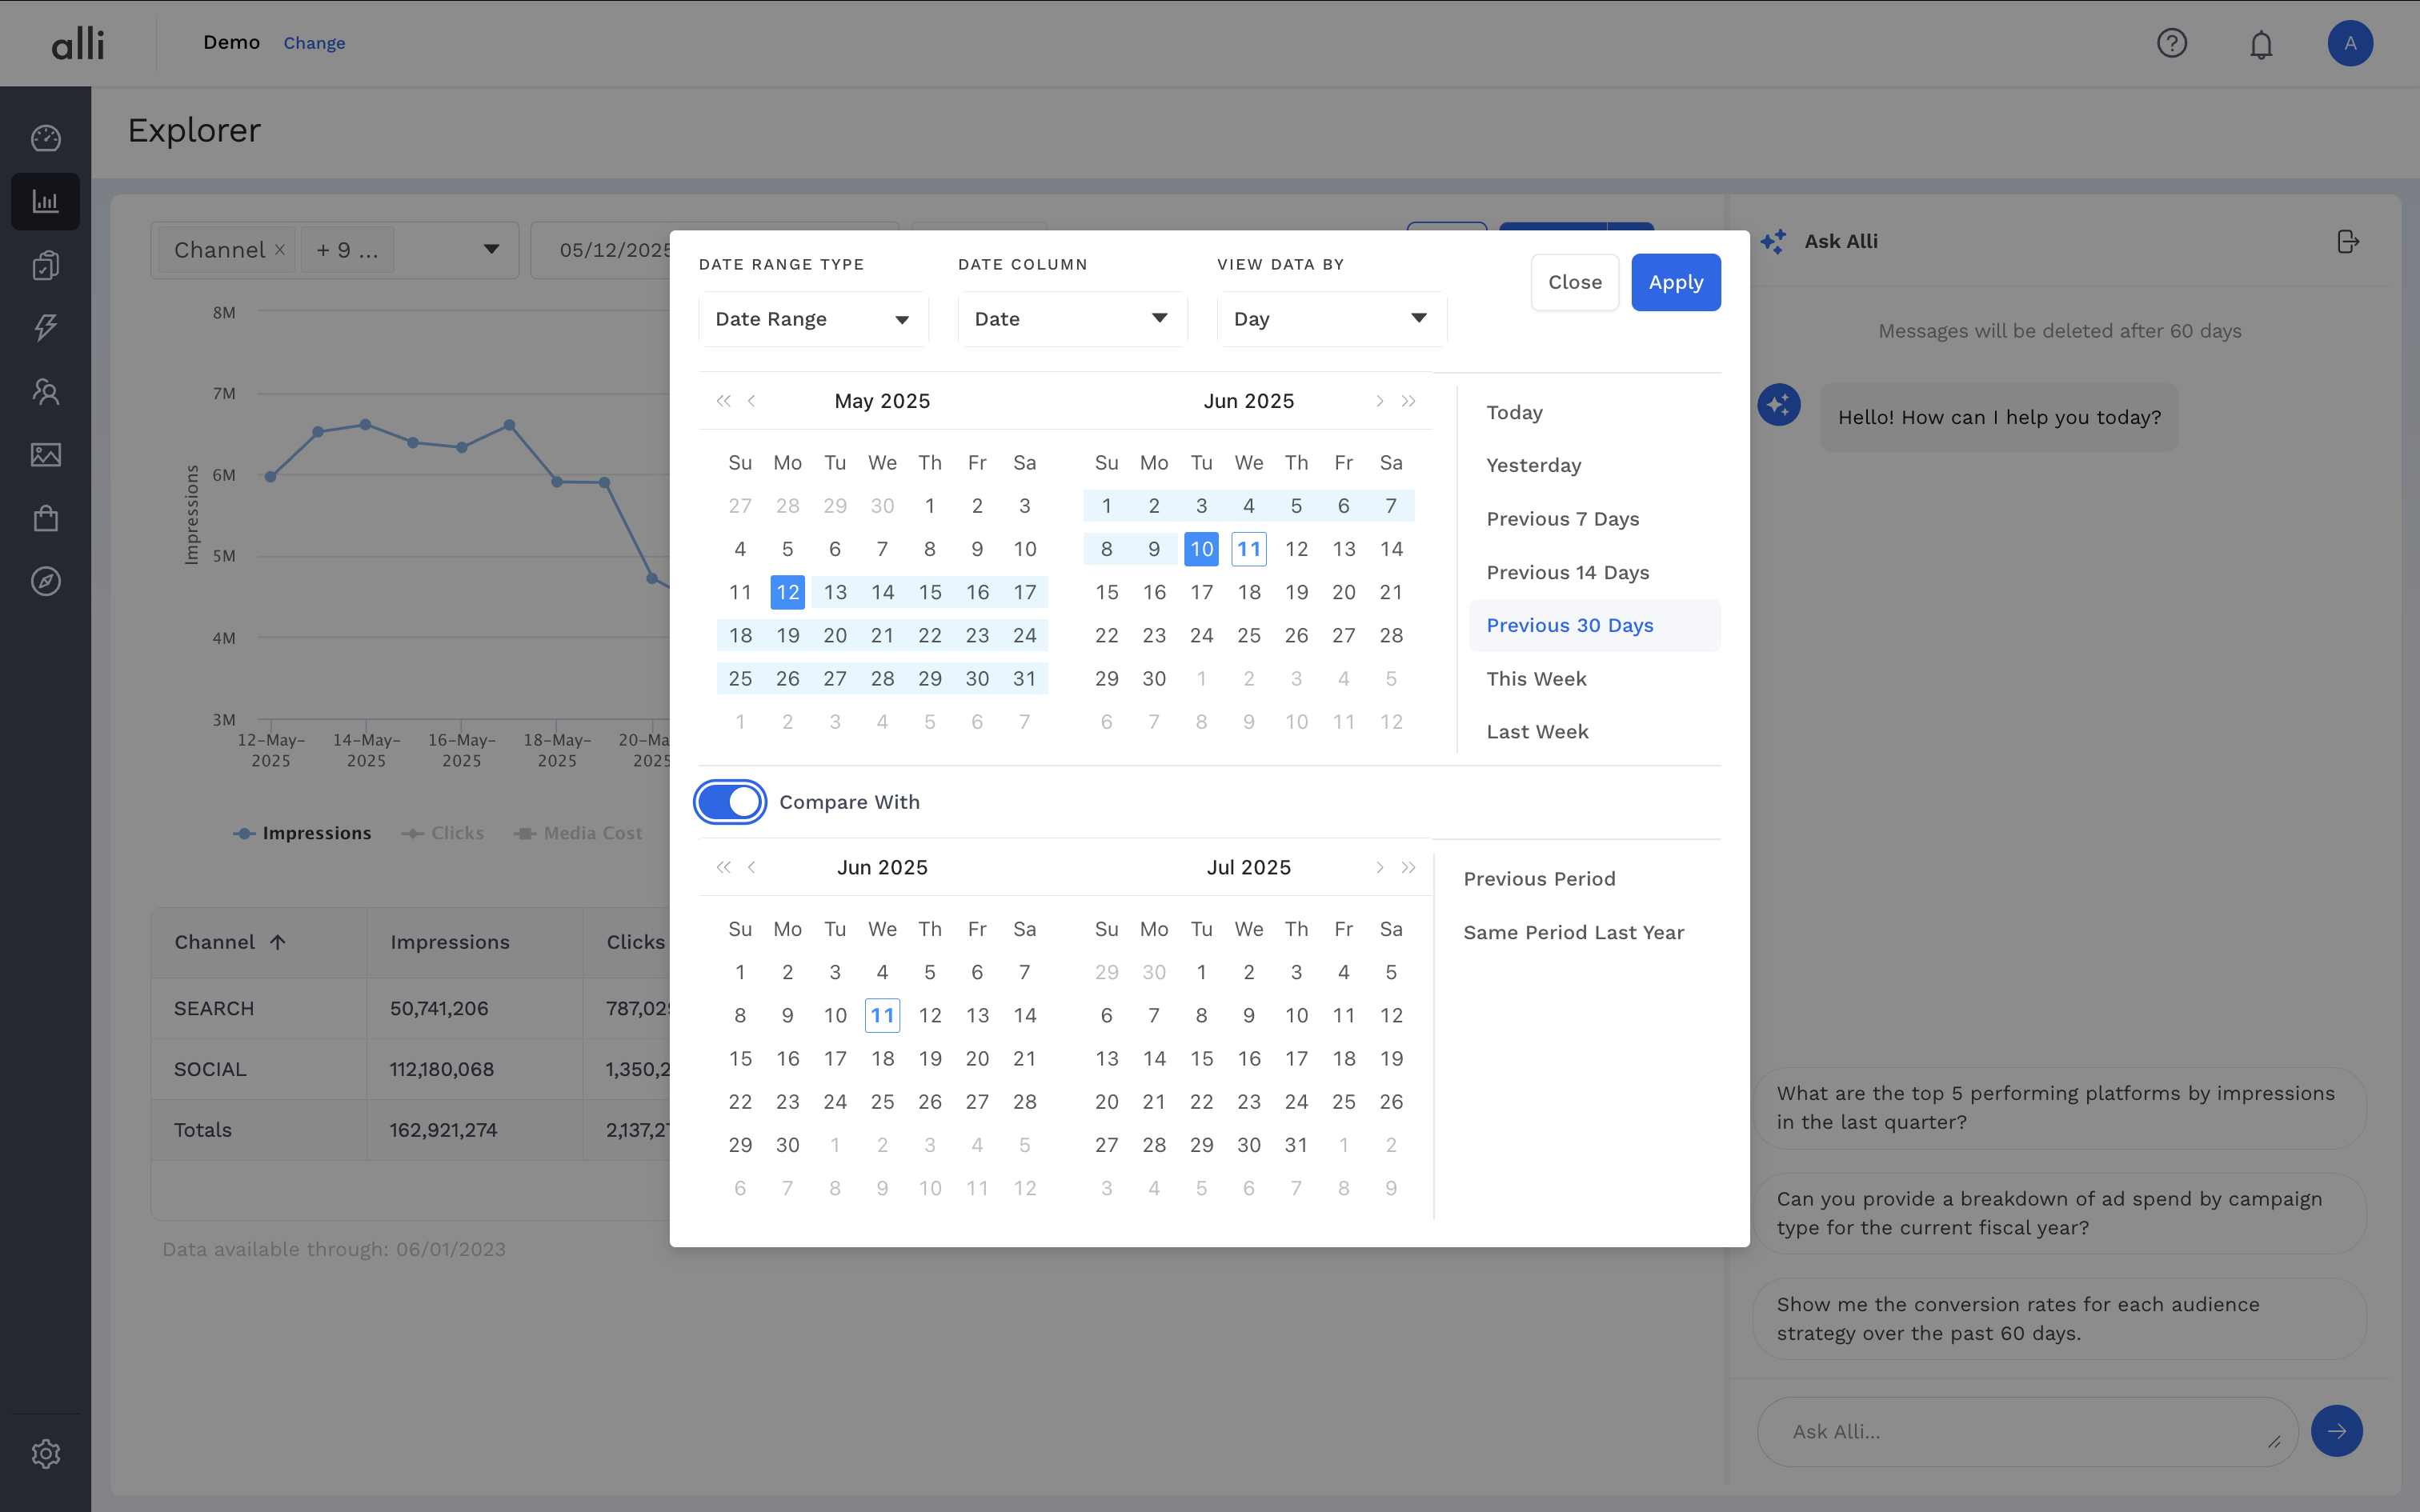
Toggle on Compare With below the calendar.
-
Use the calendar or preset options to choose your comparison date range and click Apply.
-
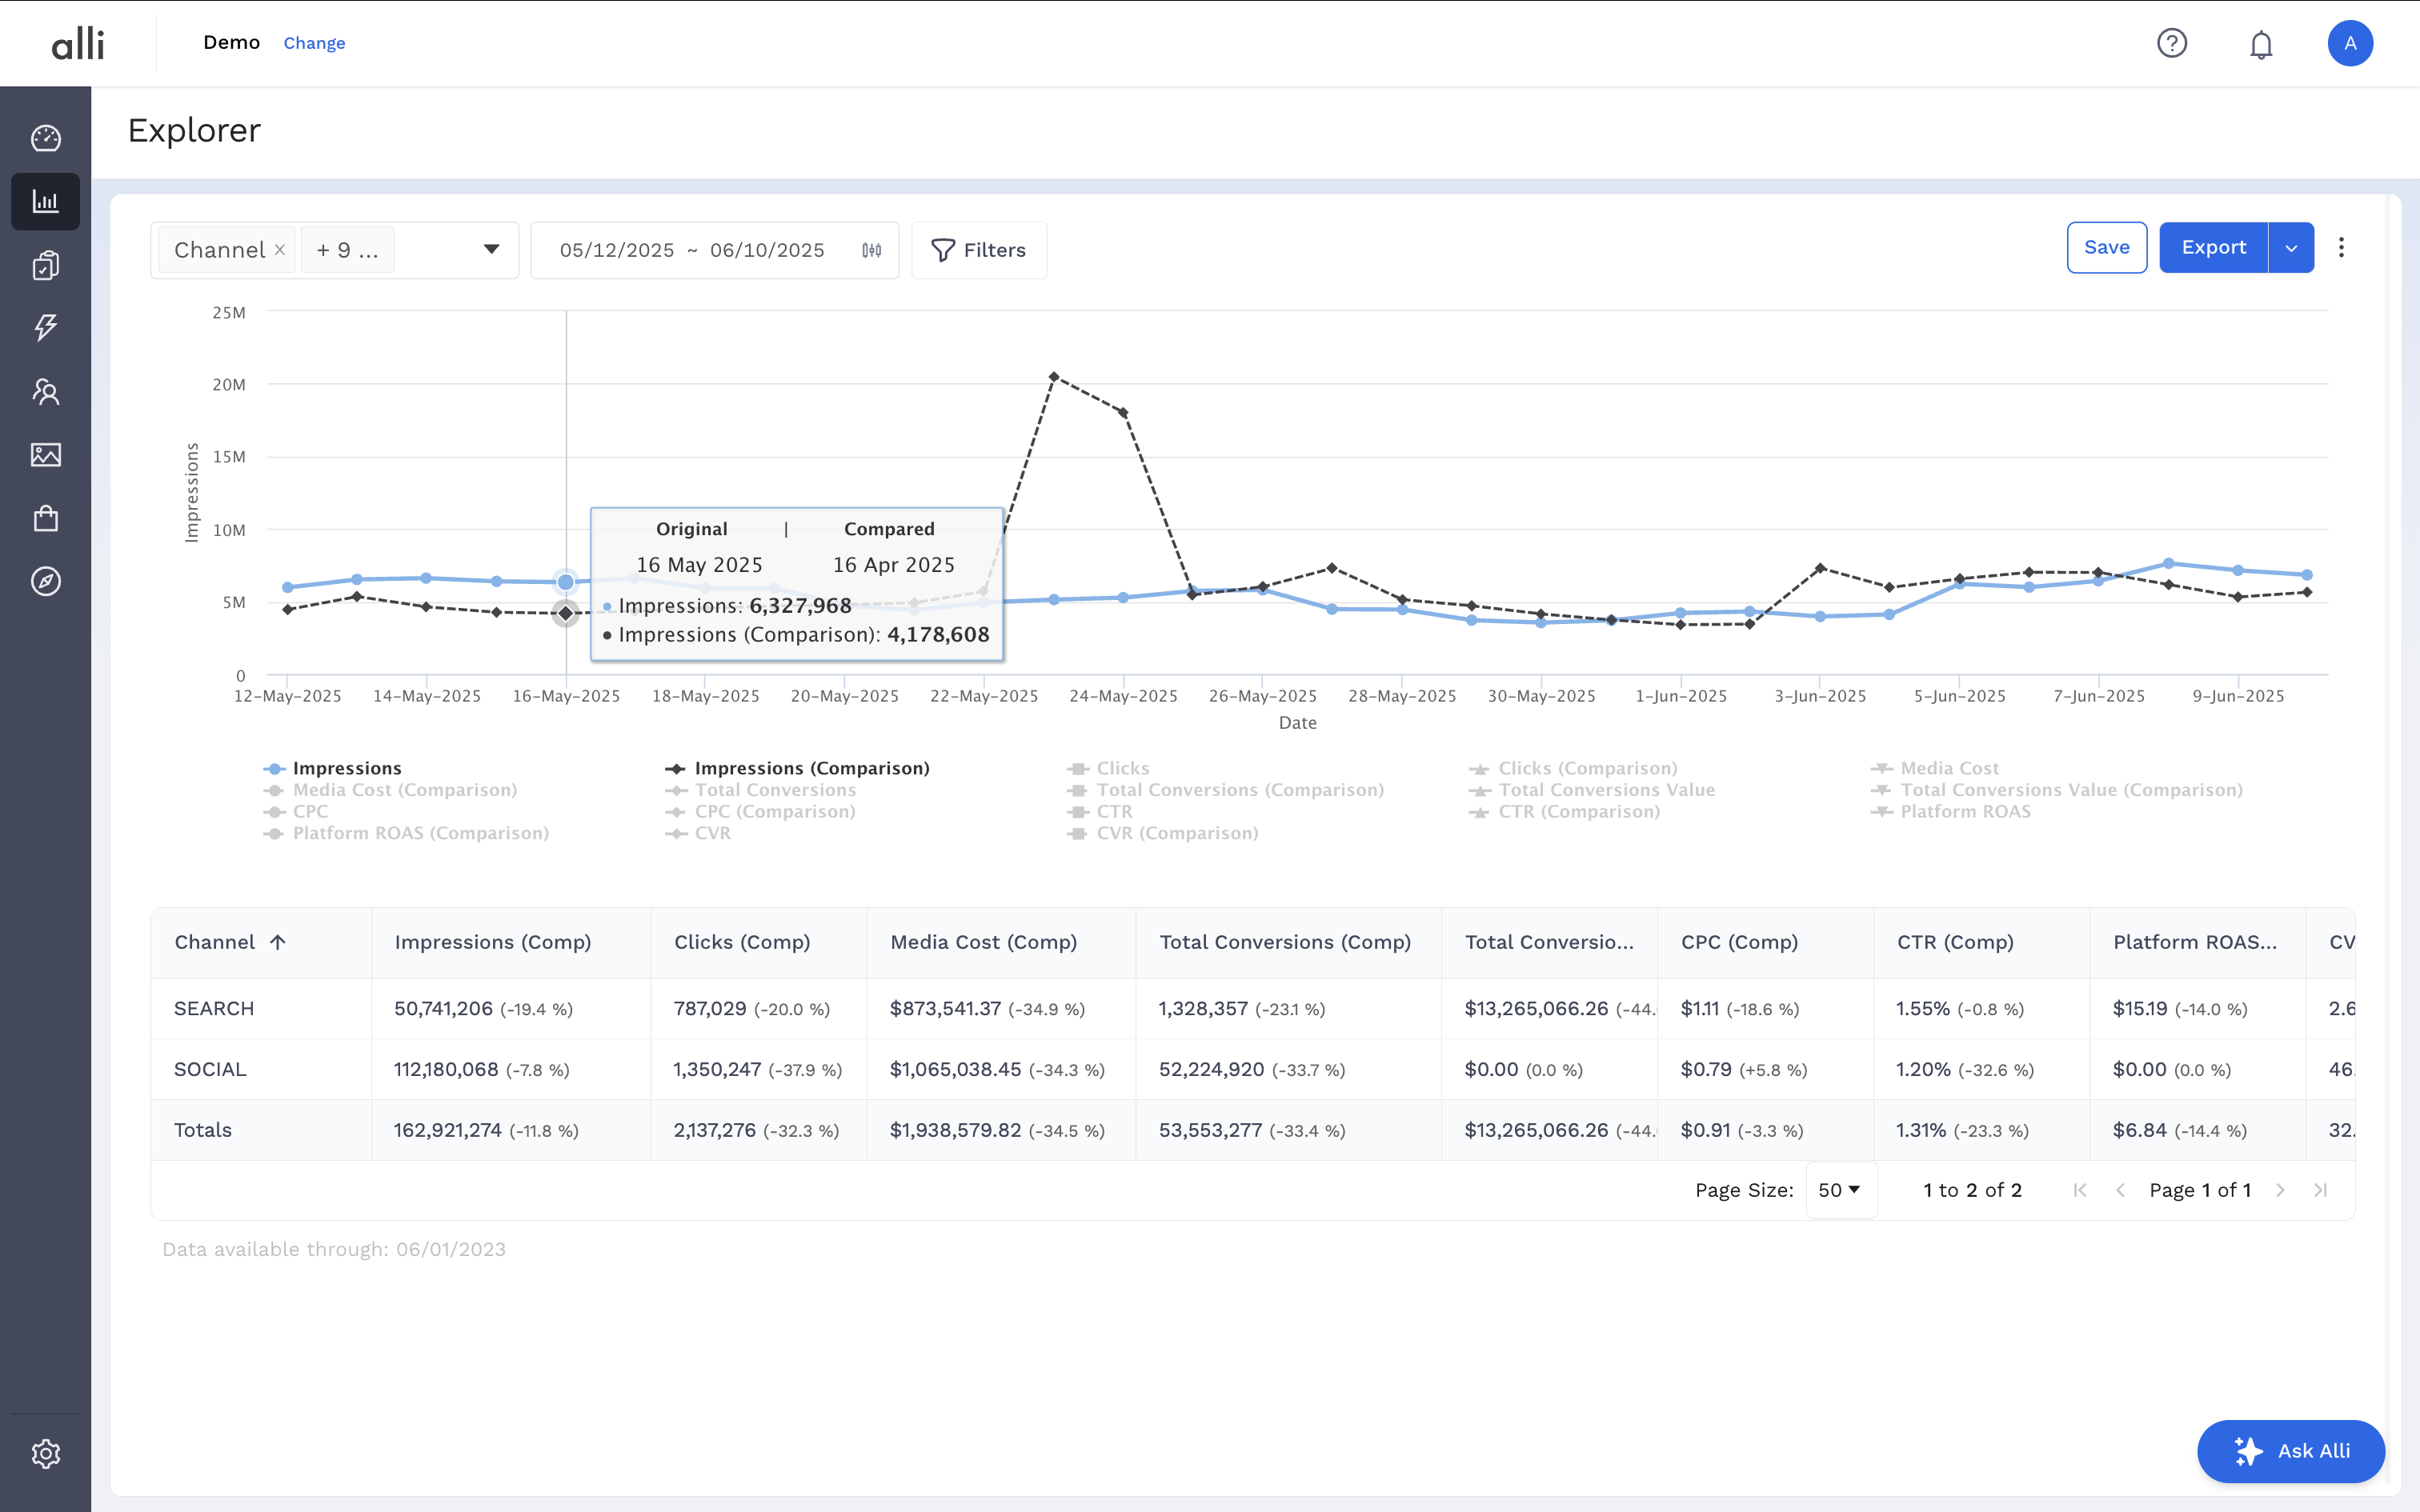
Explorer will update to show both periods across:
-
Line graphs with tooltips showing both values per date
-
Tables with original, comparison on hover, and delta (% change)
-
Related articles
- How-To: Use categorizations within your custom report
- How-to add a new datasource to an existing Data Studio dashboard
- Advanced Guide: Enabling Big Query for a Custom Alert
- How-To: Name Datasource Columns
- How-To: Enable Product Feed Reporting
- How-To: Include Custom DSP Cost in Display Reporting
- How-To: Add a new categorization
- Tutorial: Getting started with Explorer Reports
- How-To: Backfill a datasource
- How-To: Categorize CM360 Conversions
- How-To: Create a new datasource
- How-to Create a Sentiment Dashboard from FB Sentiment
- How-To: Identify Which Platforms and Report Types are Enabled for Reporting
- How-To: Enable Device and Demographic Reporting
- How-To: Manually upload data to an existing datasource