
Overview
This app will download datapoints from the TikTok trends data and store it into Alli Cloud Storage. From there, you can create alerts and other solutions based off of the data.
Instructions for Trend Graph Preview
-
Please go to marketplace and install our app: TikTok Trends
-
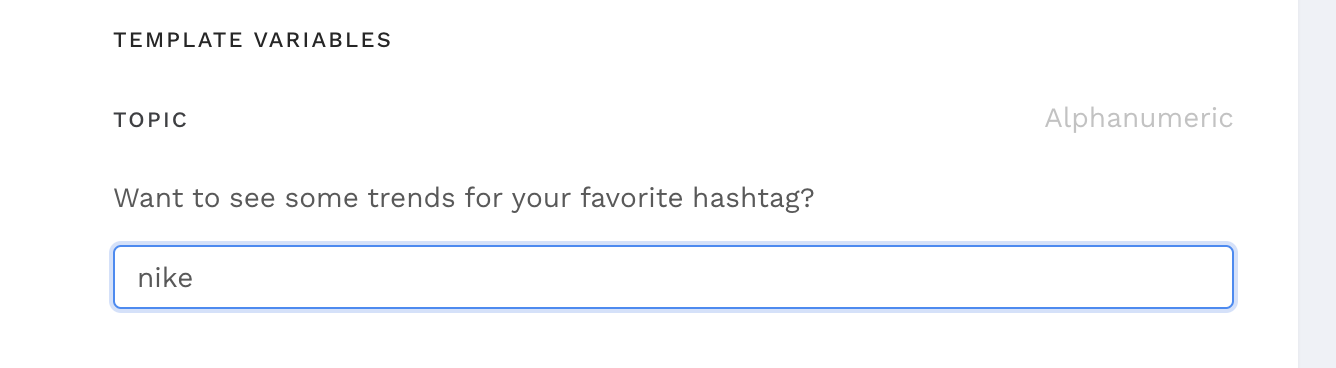
The app will ask a couple of questions on the right:
-
Choose the topic of your interest. Say I am really interested in #Nike
The value in graph represents a relative search volume compare to its peak. It does not represent actual view in any ways!
If you have multiple alerts, please set them apart for a couple of minutes in case of congestion. Do not have everything fire at 10 am for example.
-
If you would like to see a preview and a simple alert message sent to Slack (default), please fill out the slack channel name, message.
-
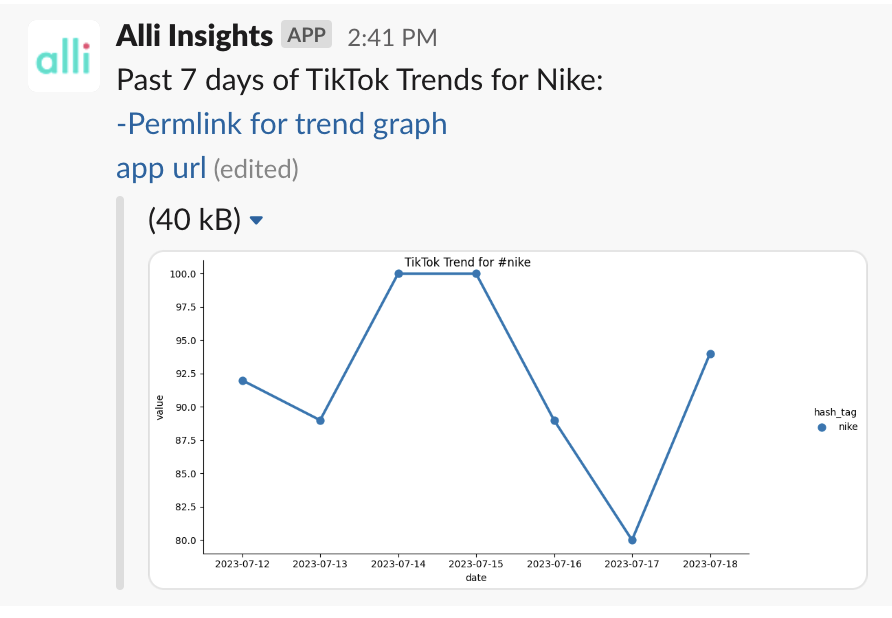
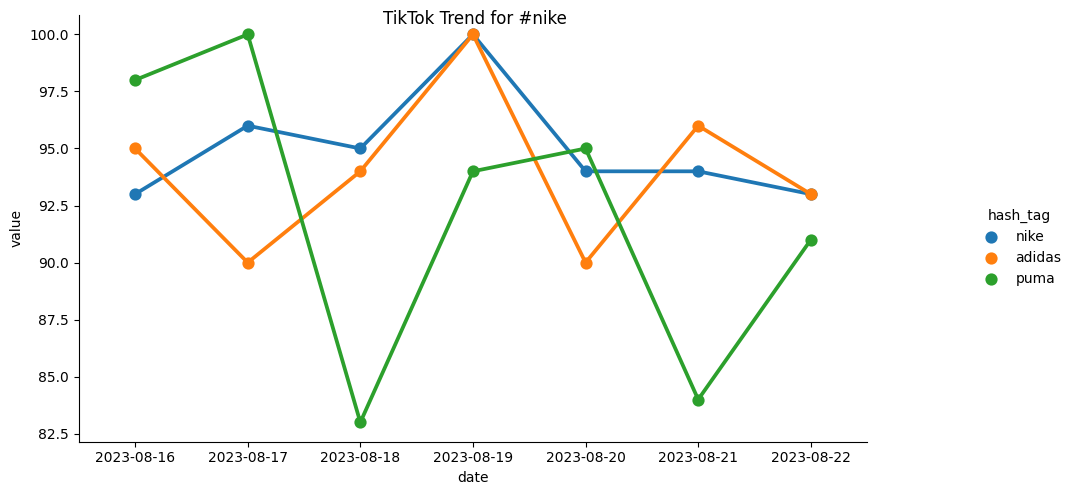
The Related topic option dictates whether or not you want your search to include surrounding topics. For example, if I am just interested in how #nike is trending on TikTok, I select no. Here is a sample result:
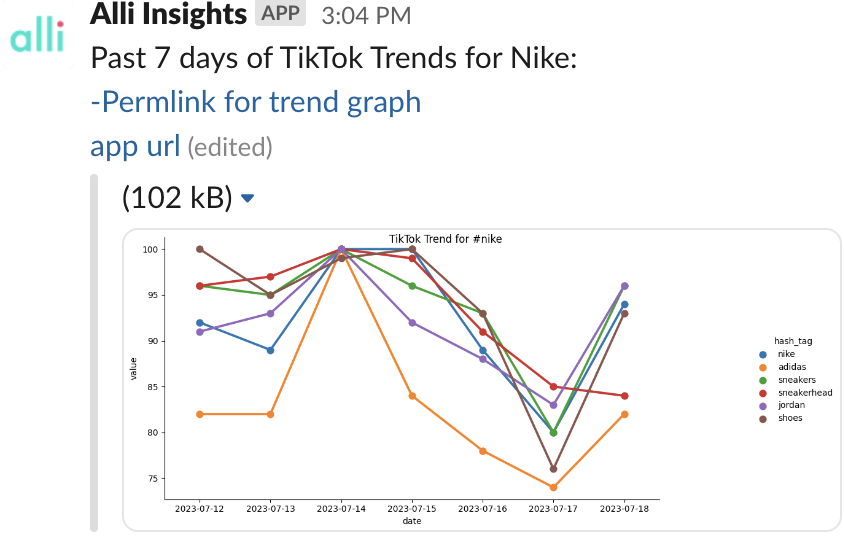
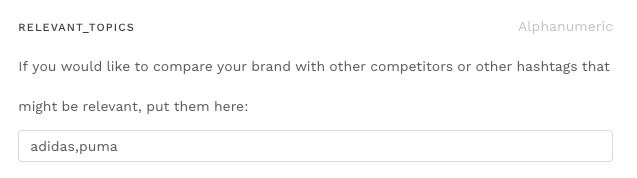
However, if I am interested in comparing Nike along with its surrounding space based on keyword association on TikTok searches, so that you may compare it across brand (shoes, sneakers…), I would select yes! Here is an example:
-
If you would like to set your own topics, the upgrade V2 version has the option to do that as well.
-
The stored data will be in Alli cloud, please refer to this article to retrieve your data so that an alert can be set up.
Instructions for Trend Alerts
-
Create a new Alli Cloud Datasource in Alli. Instructions can be found here How to use Alli Cloud Storage in an Alli Data datasource
-
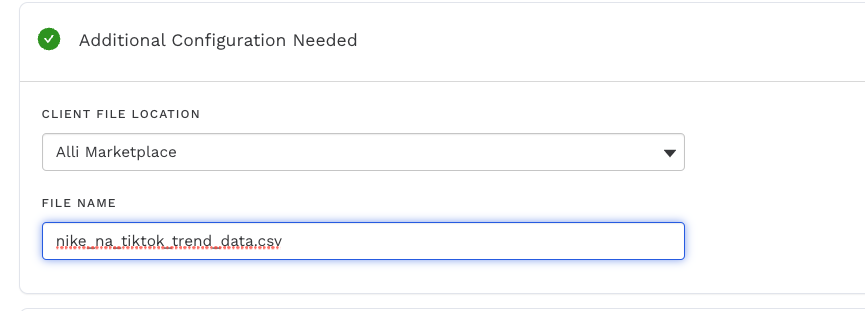
The file name will always be “{client}_tiktok_trend_data.csv”. For example, the file for nike will be named nike_tiktok_trend_data.csv.
-
-
Make sure you fill in the columns information before loading:
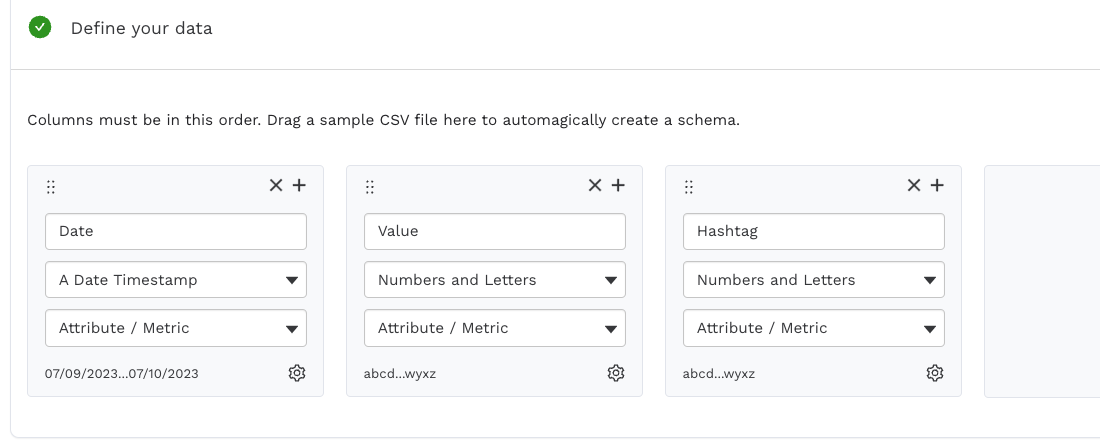
-
then you are all set! The data is in. If you would like to set up a more advanced alert (i.e., alert for everyday that the trends actually went up, please reach out to your analytics person). Here I have a sample SQL code that will help you get started:
select date, value as current_value, lag * {1.1} as yesterday_value
from
(
  select date, value, LAG(value, 1) over (order by date)
  from client_slug.tiktok_weekly_trend_s3_cloudstorage
  where hashtag = 'nike'
)
where current_value > yesterday_value
This will tell you exactly what dates has the trend up more than 10 percent. You can adjust {1.1} in line 1 for your liking.
Please note that the #hashtag must exist in TikTok trend space. Please refer to the actual page for further insight:https://ads.tiktok.com/business/creativecenter/hashtag/overnightoats/pc/en?countryCode=US&period=7
However, #TommyhilfigureShoes Will not work because 1) the hashtag does not exist, 2) https://ads.tiktok.com/business/creativecenter/hashtag/tommyhilfigureshoes/pc/en?countryCode=US&period=7 does not exist!
Related articles
- How-To: Connect your Google Sheet to Actions
- How-To: Disable or Remove an Installed App
- How-To: Set Up a New Workflow
- How-To: Pull Data for TikTok Trends
- How-To: send a deployment to The Trade Desk
- How-To: View Error Messages on an Action That Ran
- How-To: Configure a Datasource
- How-To: Use categorizations within your custom report
- How-To: Filter Alli Data Reports by Date to Power Actions - Tips & Tricks
- How-to add a new datasource to an existing Data Studio dashboard
- How-To: Create a new Dashboard Section
- How-To: Check a Feed Import or Deployment Status
- How-To: Understanding Version Statuses
- Advanced Guide: Enabling Big Query for a Custom Alert
- How-To: Authenticate a Partner Platform to Deploy Audiences